Open Access
Fig. 7
Download original image
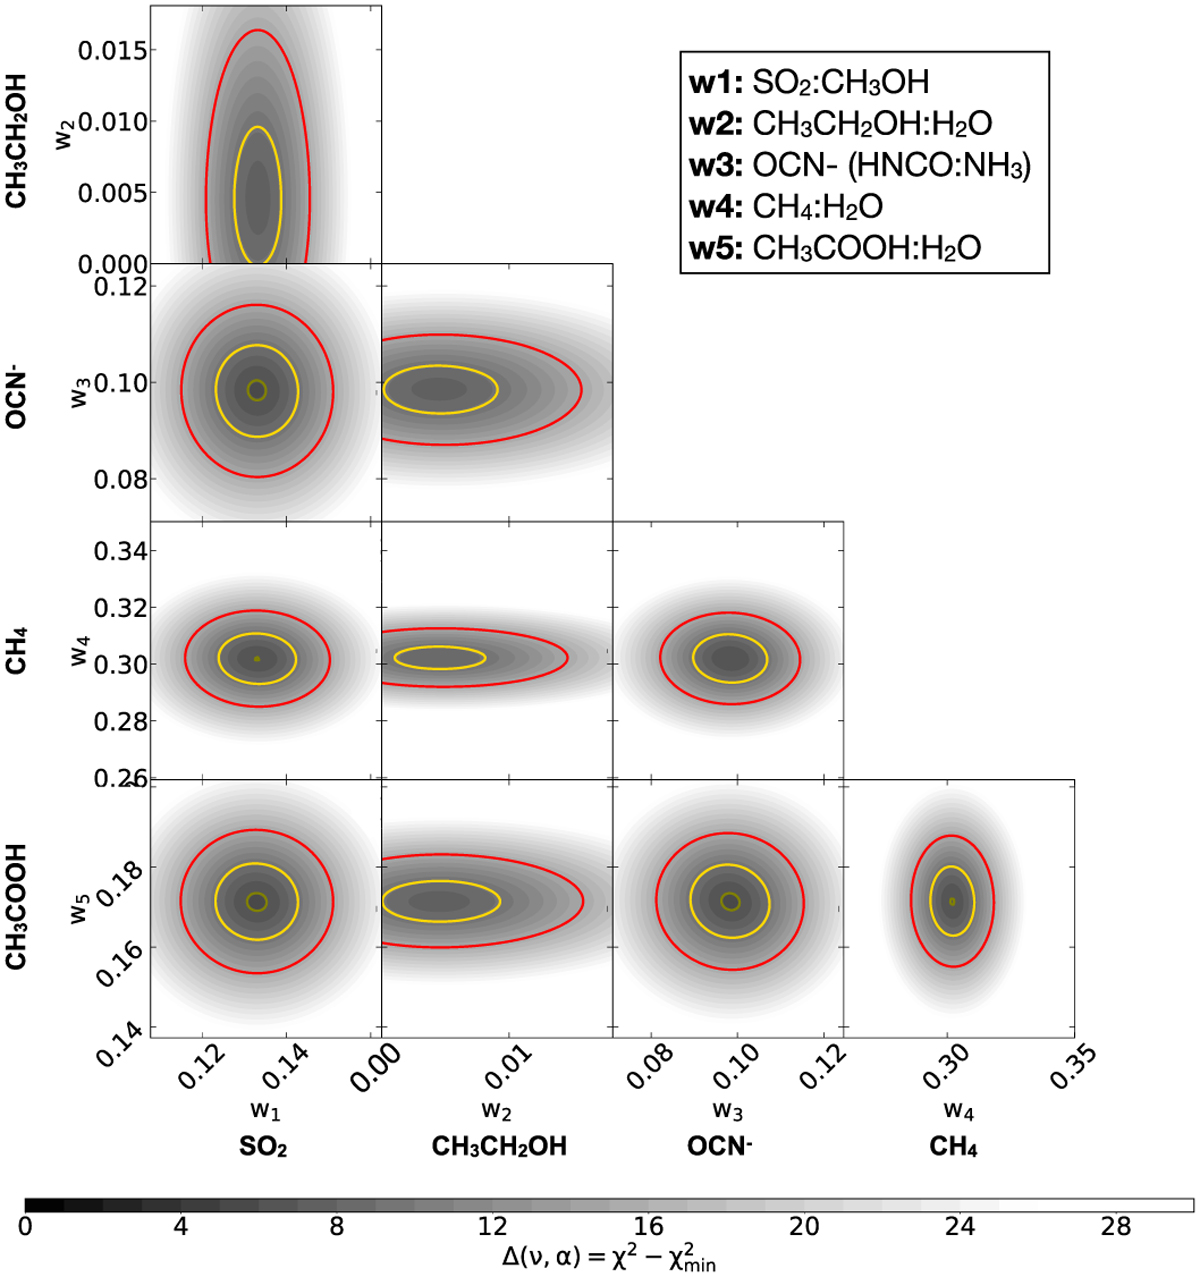
Corner plots showing the IRAS 2A coefficient confidence intervals for the range between 7.5 and 7.8 µm. The grey scale colour is the Δχ2 map derived from a total of 5000 values. Yellow and red contours represent 2 and 3σ significance, respectively.
Current usage metrics show cumulative count of Article Views (full-text article views including HTML views, PDF and ePub downloads, according to the available data) and Abstracts Views on Vision4Press platform.
Data correspond to usage on the plateform after 2015. The current usage metrics is available 48-96 hours after online publication and is updated daily on week days.
Initial download of the metrics may take a while.