Fig. 6
Download original image
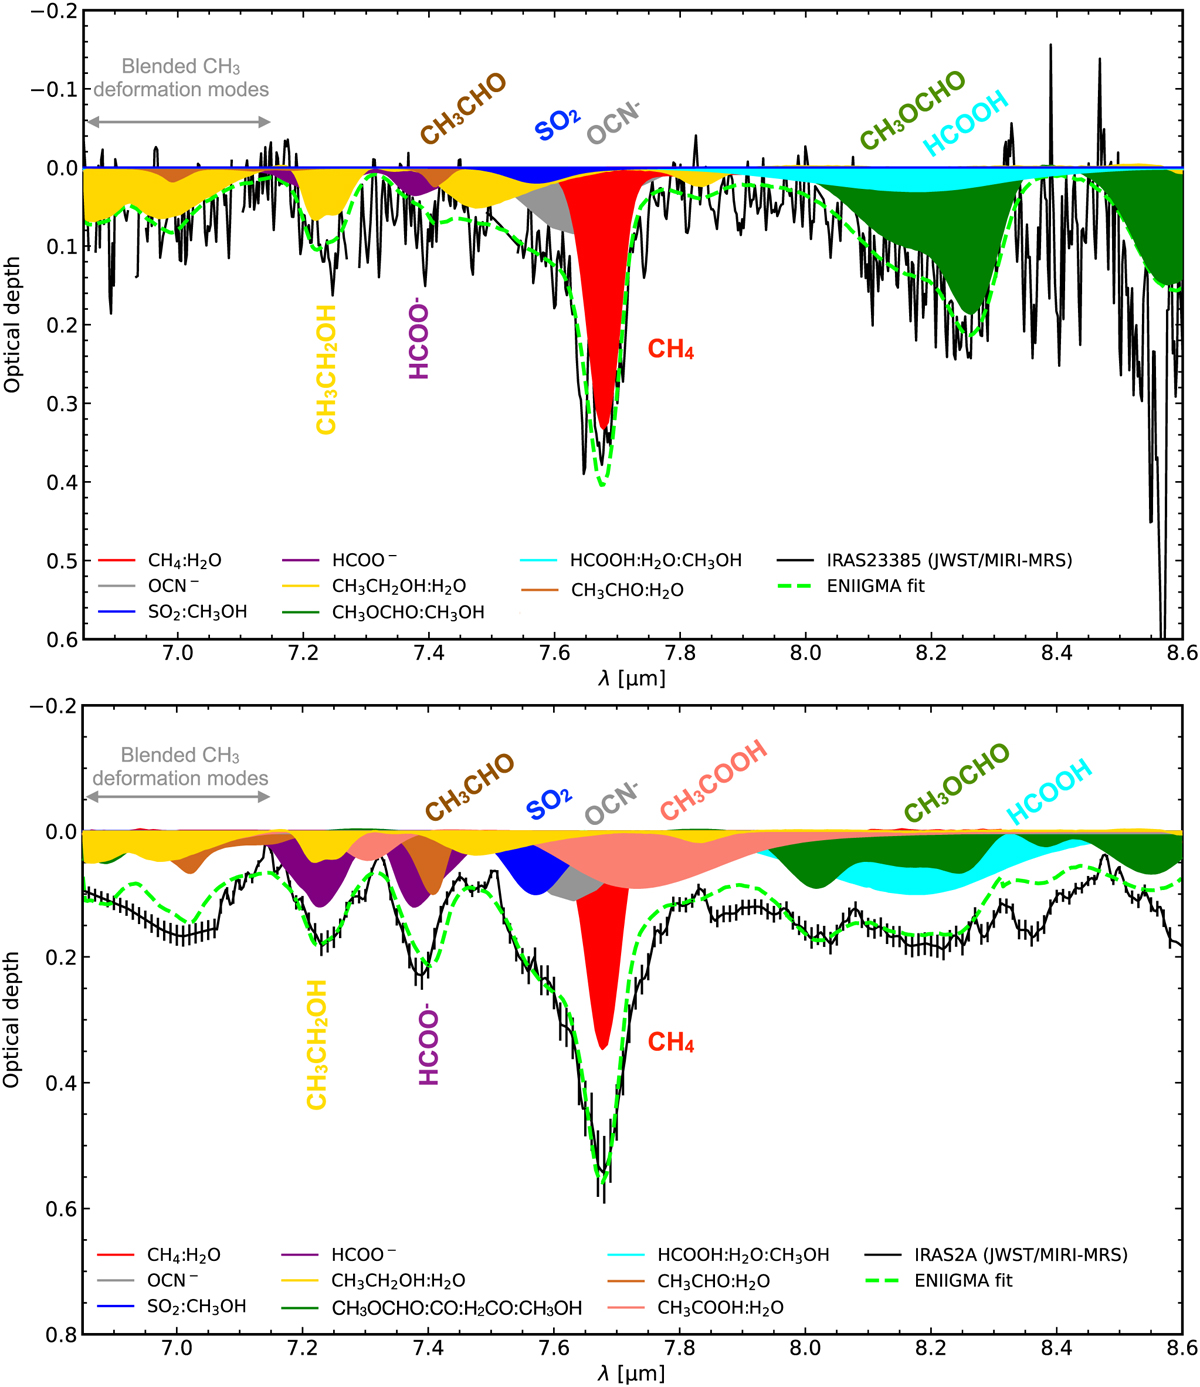
ENIIGMA fits of IRAS 23385 (top) and IRAS 2A (bottom). Gas-phase lines are masked. The figure labels show the ice mixture used in the fits, and a simplified version with the names of the chemical species names is shown close to the bands. The corresponding temperature of these laboratory spectra ranges between 10 K and 15 K.
Current usage metrics show cumulative count of Article Views (full-text article views including HTML views, PDF and ePub downloads, according to the available data) and Abstracts Views on Vision4Press platform.
Data correspond to usage on the plateform after 2015. The current usage metrics is available 48-96 hours after online publication and is updated daily on week days.
Initial download of the metrics may take a while.