Open Access
Fig. 5
Download original image
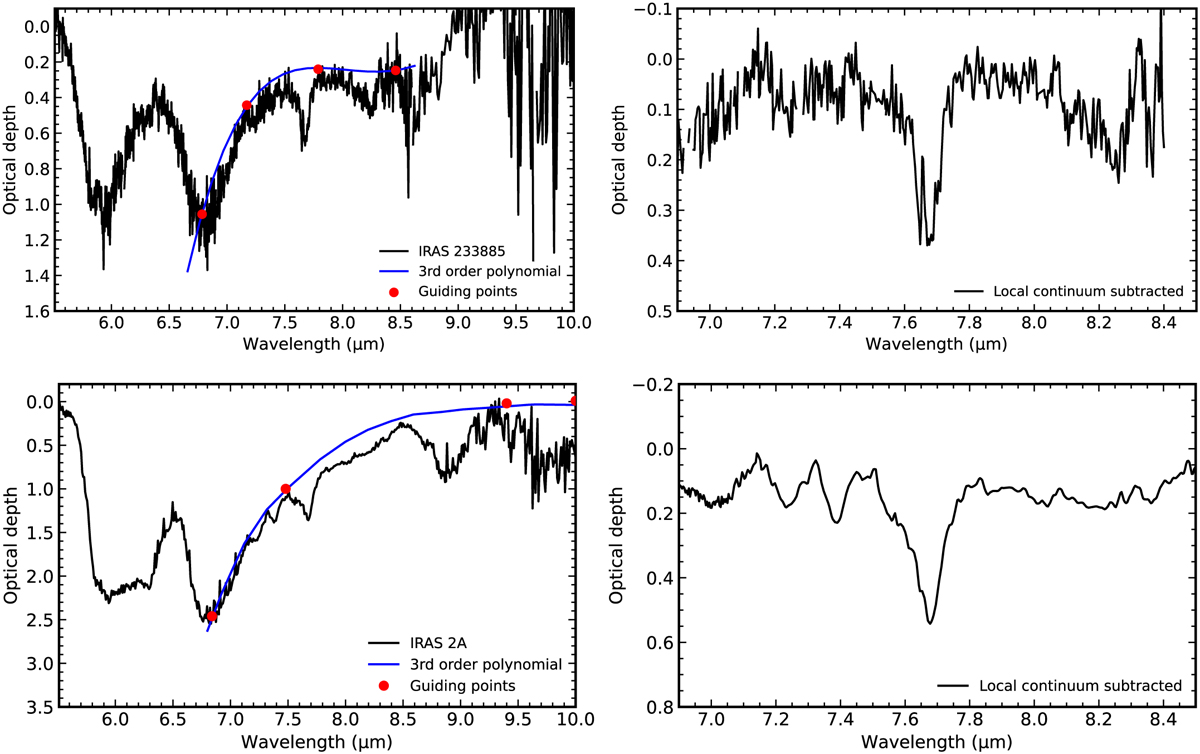
Procedure for isolating weaker absorption features in the spectra of IRAS 23385 and IRAS 2A. Left: local continuum in the 6.8–8.6 spectral range using a fourth-order polynomial function. Right: isolated 6.8-8.6 optical depth spectrum in both protostars.
Current usage metrics show cumulative count of Article Views (full-text article views including HTML views, PDF and ePub downloads, according to the available data) and Abstracts Views on Vision4Press platform.
Data correspond to usage on the plateform after 2015. The current usage metrics is available 48-96 hours after online publication and is updated daily on week days.
Initial download of the metrics may take a while.