Fig. 4
Download original image
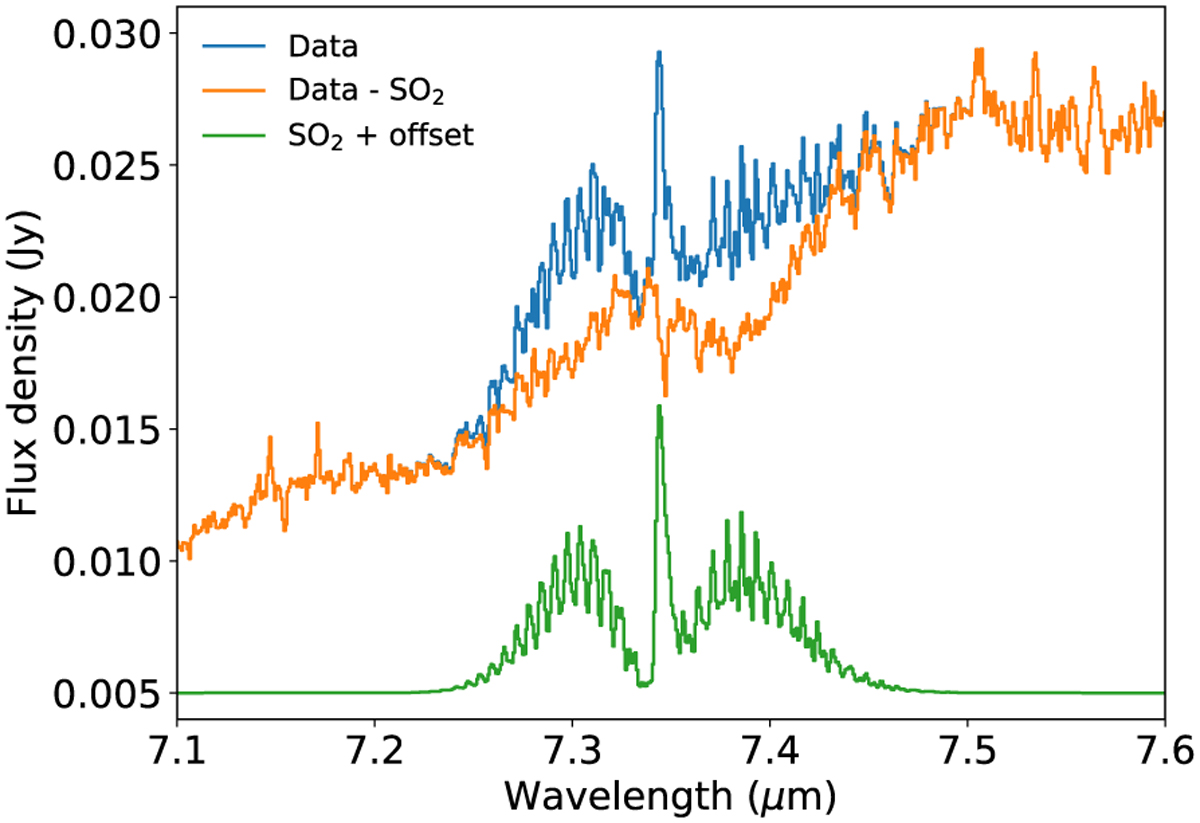
Observed spectrum of IRAS 2A (blue) surrounding the 7.2 µm and 7.4 µm ice absorption features with SO2 (ν3) emission. The best-fit SO2 model of van Gelder et al. (2024) is presented in green and the SO2 subtracted spectrum of IRAS2A is shown in orange. Subtracting the SO2 emission clearly reveals the 7.4 µm absorption feature.
Current usage metrics show cumulative count of Article Views (full-text article views including HTML views, PDF and ePub downloads, according to the available data) and Abstracts Views on Vision4Press platform.
Data correspond to usage on the plateform after 2015. The current usage metrics is available 48-96 hours after online publication and is updated daily on week days.
Initial download of the metrics may take a while.