Open Access
Fig. K.2
Download original image
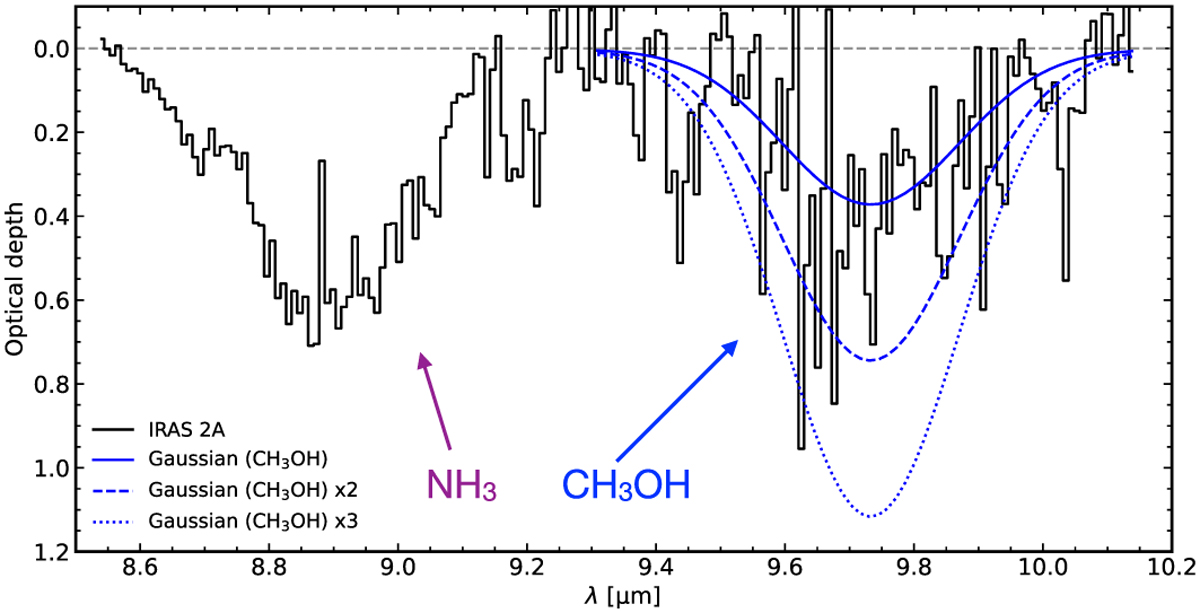
NH3 and CH3OH features in the bottom of the silicate band and H2O ice subtracted spectra of IRAS 2A. Three Gaussian profiles are scaled to the CH3OH band to indicate different ice column densities.
Current usage metrics show cumulative count of Article Views (full-text article views including HTML views, PDF and ePub downloads, according to the available data) and Abstracts Views on Vision4Press platform.
Data correspond to usage on the plateform after 2015. The current usage metrics is available 48-96 hours after online publication and is updated daily on week days.
Initial download of the metrics may take a while.