Fig. 3
Download original image
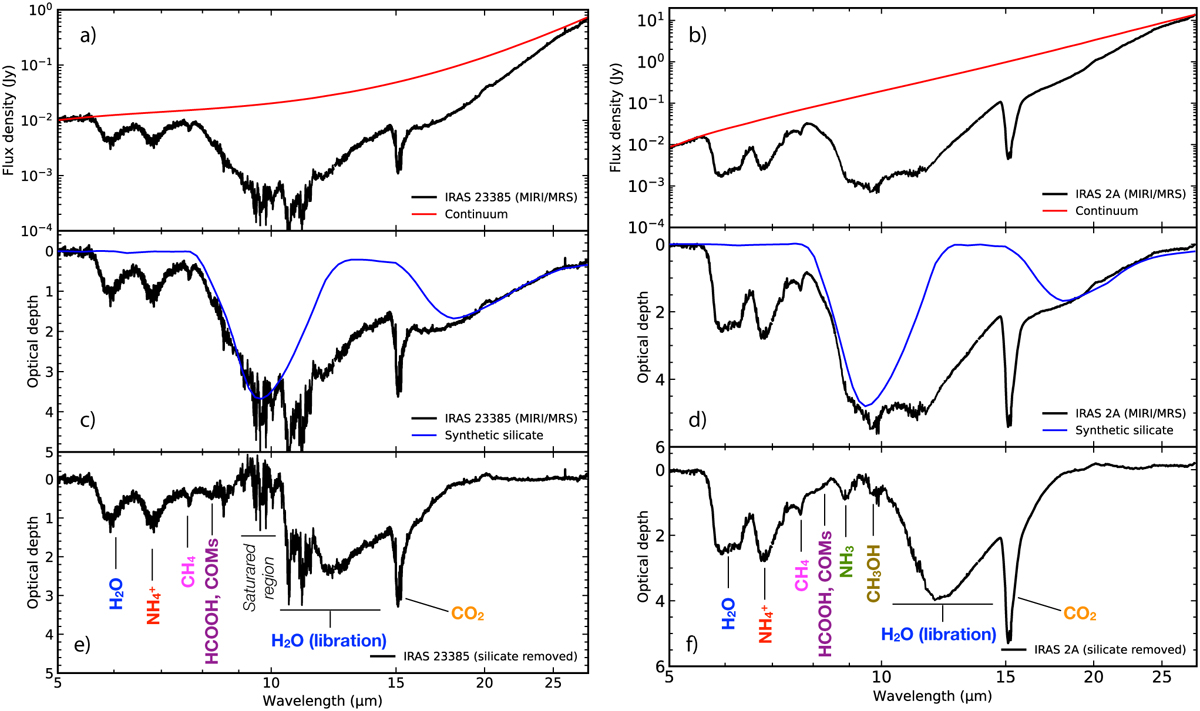
Continuum (a, b) and silicate subtraction (c, d) steps in IRAS 23385 (left) and IRAS 2A (right). The spectrum of IRAS 23385 is binned by a factor of two between 9 and 11 µm due to the saturated silicate profile. A third-order polynomial function is used to trace the continuum, and the silicate profile is a combination of two laboratory silicate spectra (olivine and pyroxene). Panels e and f show the silicate subtracted spectra of both protostars, with major features labelled.
Current usage metrics show cumulative count of Article Views (full-text article views including HTML views, PDF and ePub downloads, according to the available data) and Abstracts Views on Vision4Press platform.
Data correspond to usage on the plateform after 2015. The current usage metrics is available 48-96 hours after online publication and is updated daily on week days.
Initial download of the metrics may take a while.