Fig. J.2
Download original image
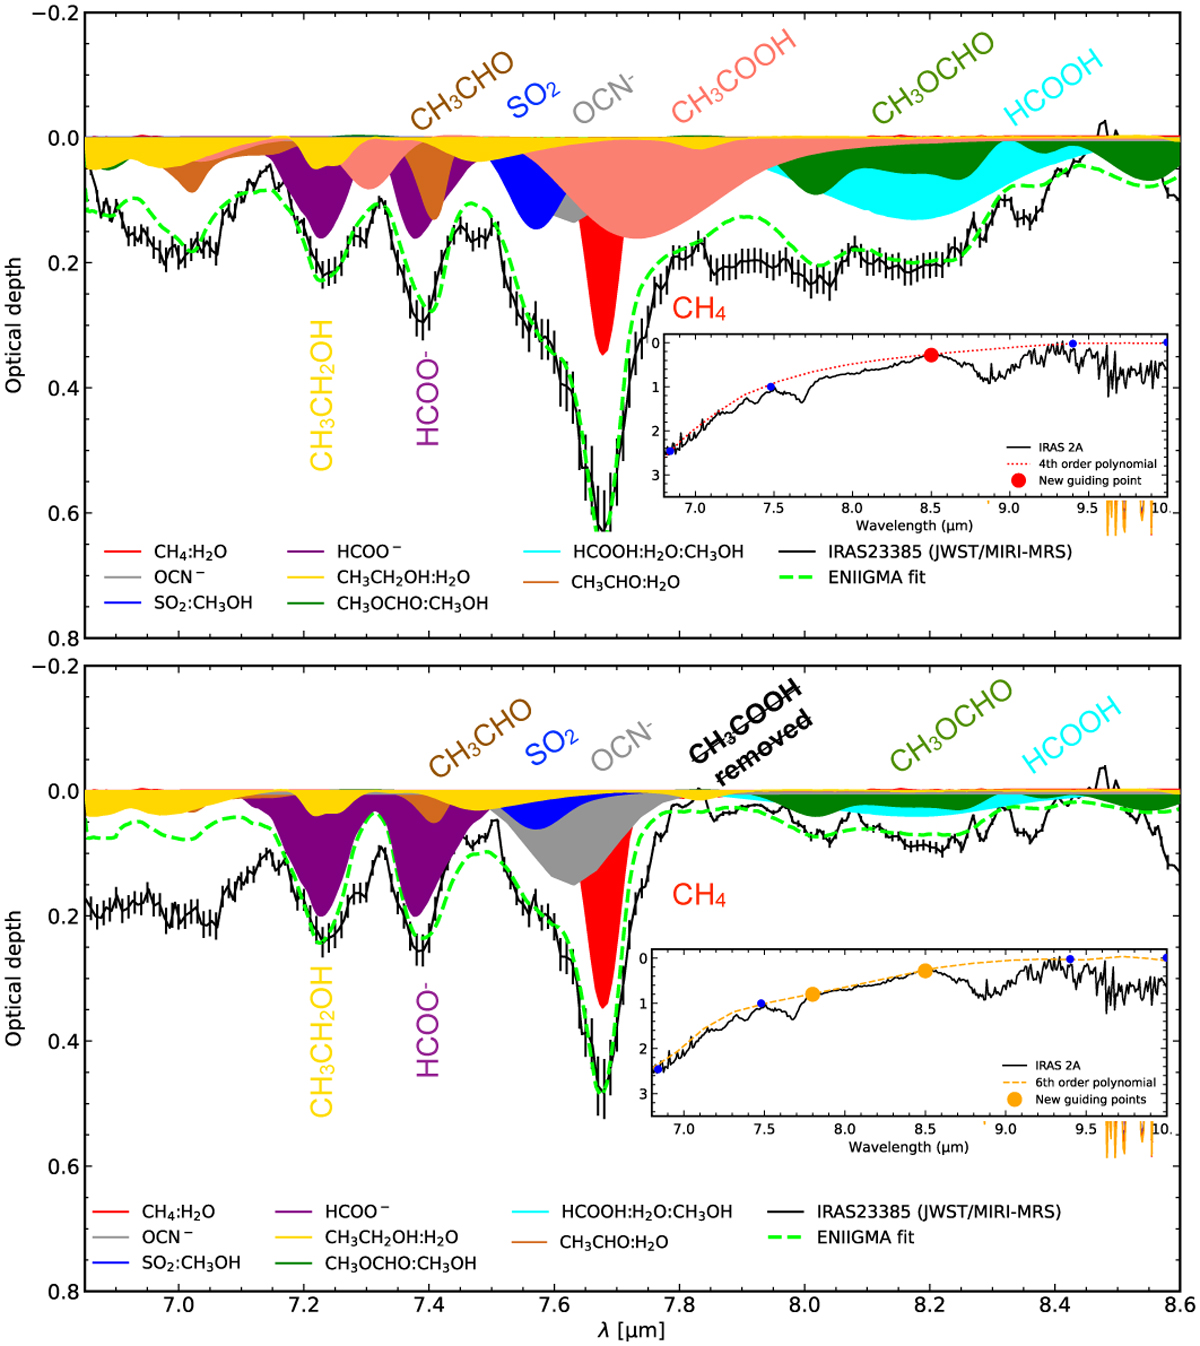
Alternative fits of IRAS 2A optical depth spectrum with different local continuum choices (see Figure J.1). The top panel shows the fits with all the components after subtracting the red local continuum with an extra point at 8.5 µm. The bottom panel shows the same as in the top panel, but considering two extra points for the local continuum (7.8 and 8.5 µm). Only CH3COOH is excluded in this fit.
Current usage metrics show cumulative count of Article Views (full-text article views including HTML views, PDF and ePub downloads, according to the available data) and Abstracts Views on Vision4Press platform.
Data correspond to usage on the plateform after 2015. The current usage metrics is available 48-96 hours after online publication and is updated daily on week days.
Initial download of the metrics may take a while.