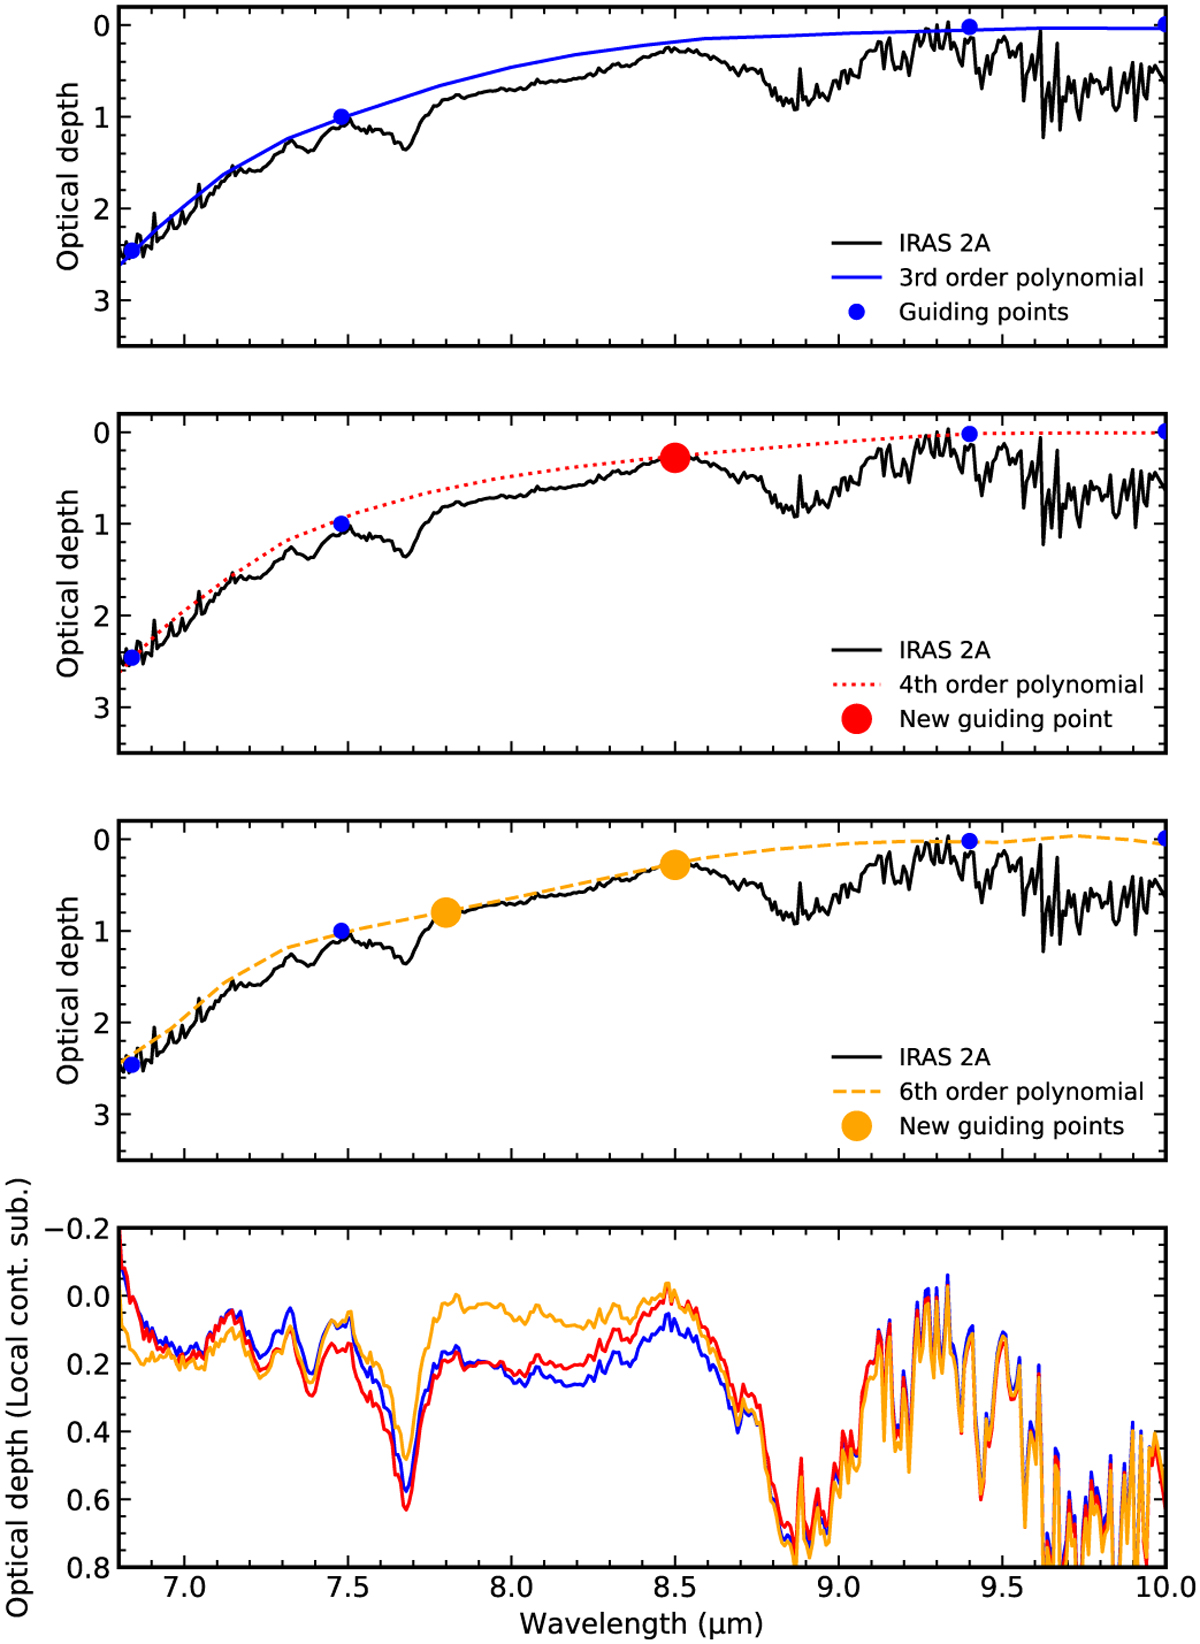
Fig. J.1
Download original image
Effect of the continuum choice on the local continuum subtracted spectrum of IRAS 2A. The first panel shows the continuum adopted as the best model in this paper. The second and third panels show two other continuum options by adding the red and orange points, respectively. The optical depth subtracted spectra are shown in the fourth panel.
Current usage metrics show cumulative count of Article Views (full-text article views including HTML views, PDF and ePub downloads, according to the available data) and Abstracts Views on Vision4Press platform.
Data correspond to usage on the plateform after 2015. The current usage metrics is available 48-96 hours after online publication and is updated daily on week days.
Initial download of the metrics may take a while.