Fig. F.1
Download original image
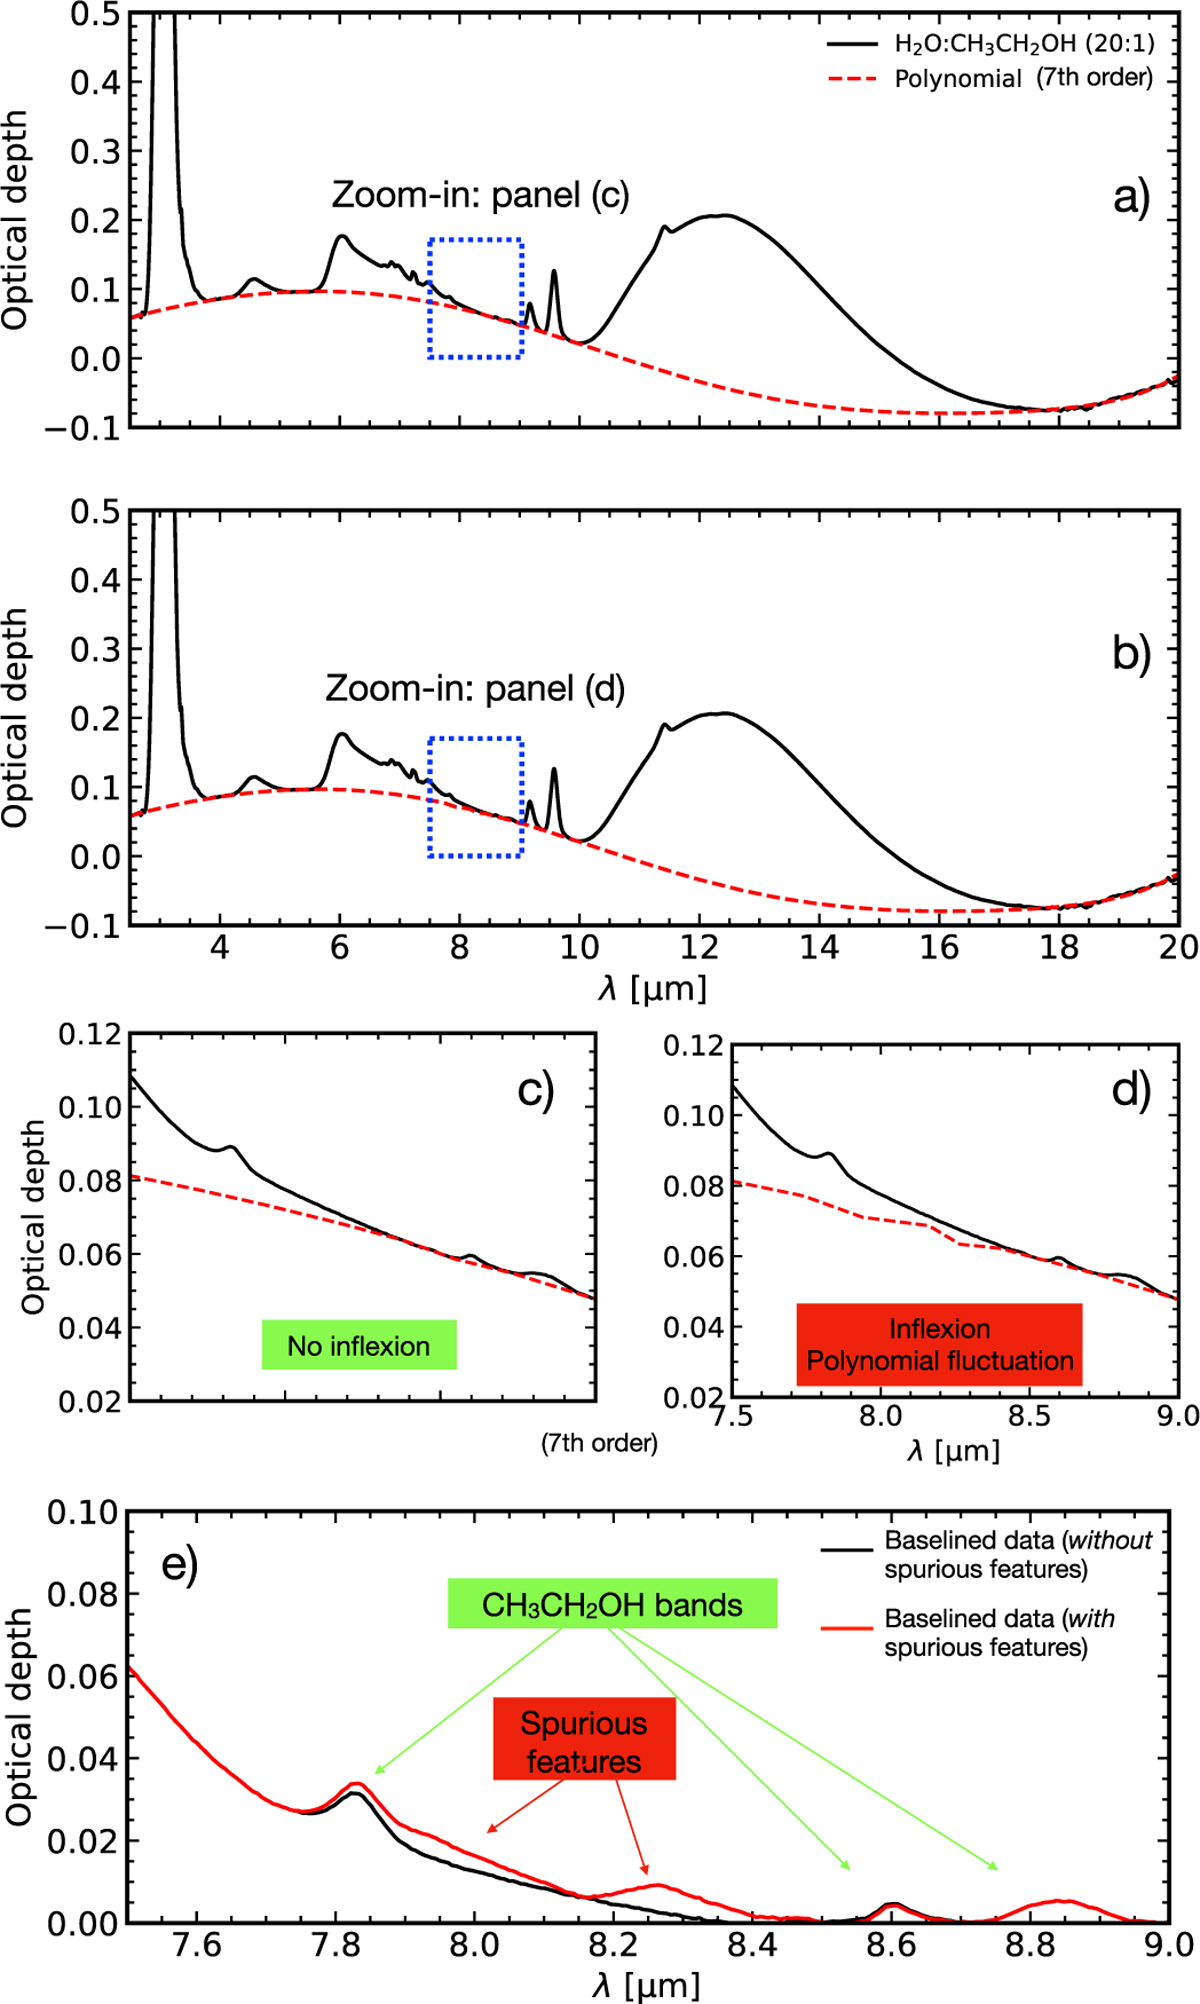
Baseline correction of the IR ice spectrum of H2O:CH3CH2OH data. Panels a and b show the IR ice spectra and the baselines. The blue dotted squares highlight the zoom-ins shown in panels c and d displaying polynomial baselines without and with little inflexion, respectively. Panel e demonstrates the effect of non-accurate baseline subtraction in the ice spectrum.
Current usage metrics show cumulative count of Article Views (full-text article views including HTML views, PDF and ePub downloads, according to the available data) and Abstracts Views on Vision4Press platform.
Data correspond to usage on the plateform after 2015. The current usage metrics is available 48-96 hours after online publication and is updated daily on week days.
Initial download of the metrics may take a while.