Fig. 16
Download original image
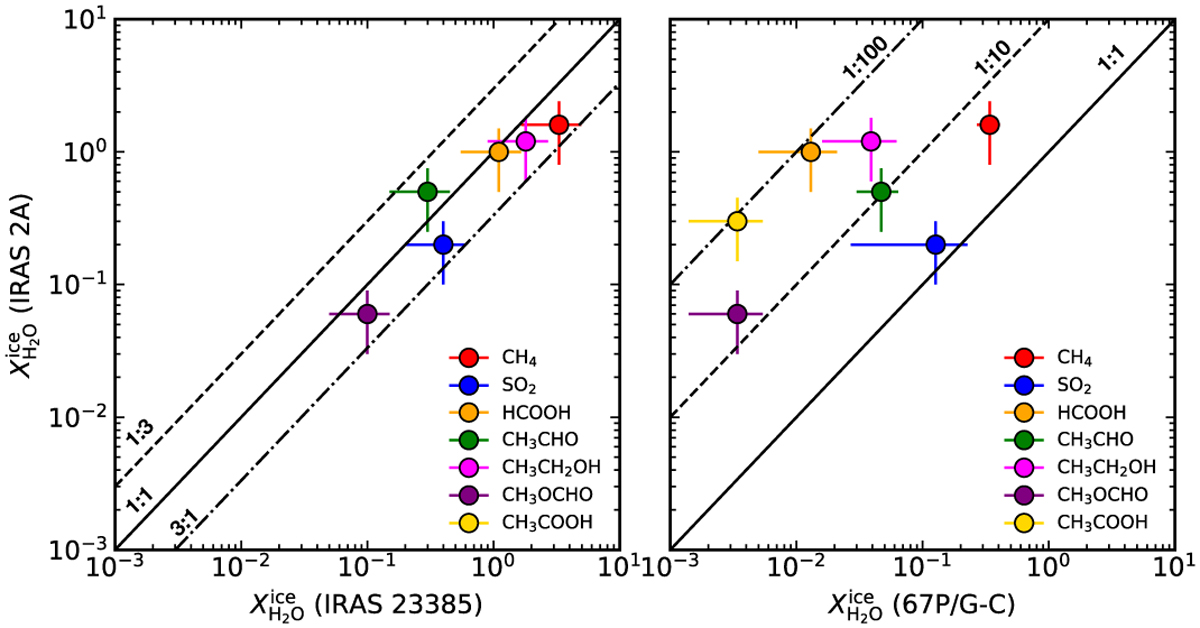
Comparison between ice abundances with respect to H2O ice. The left panel shows the ice abundances in IRAS 2A and IRAS 23385. The solid line indicates the 1:1 abundance relation, whereas the dashed and dot-dashed lines indicate the enhancement and diminution of IRAS 23385 abundance by a factor of 3. The right panel compares the ice abundances between IRAS 2A and the comet 67P/G-C from Rubin et al. (2019). The solid line indicates the same as in the left panel. The dot-dashed and dashed lines indicate a cometary abundance lower by a factor of 10 and 100, respectively.
Current usage metrics show cumulative count of Article Views (full-text article views including HTML views, PDF and ePub downloads, according to the available data) and Abstracts Views on Vision4Press platform.
Data correspond to usage on the plateform after 2015. The current usage metrics is available 48-96 hours after online publication and is updated daily on week days.
Initial download of the metrics may take a while.