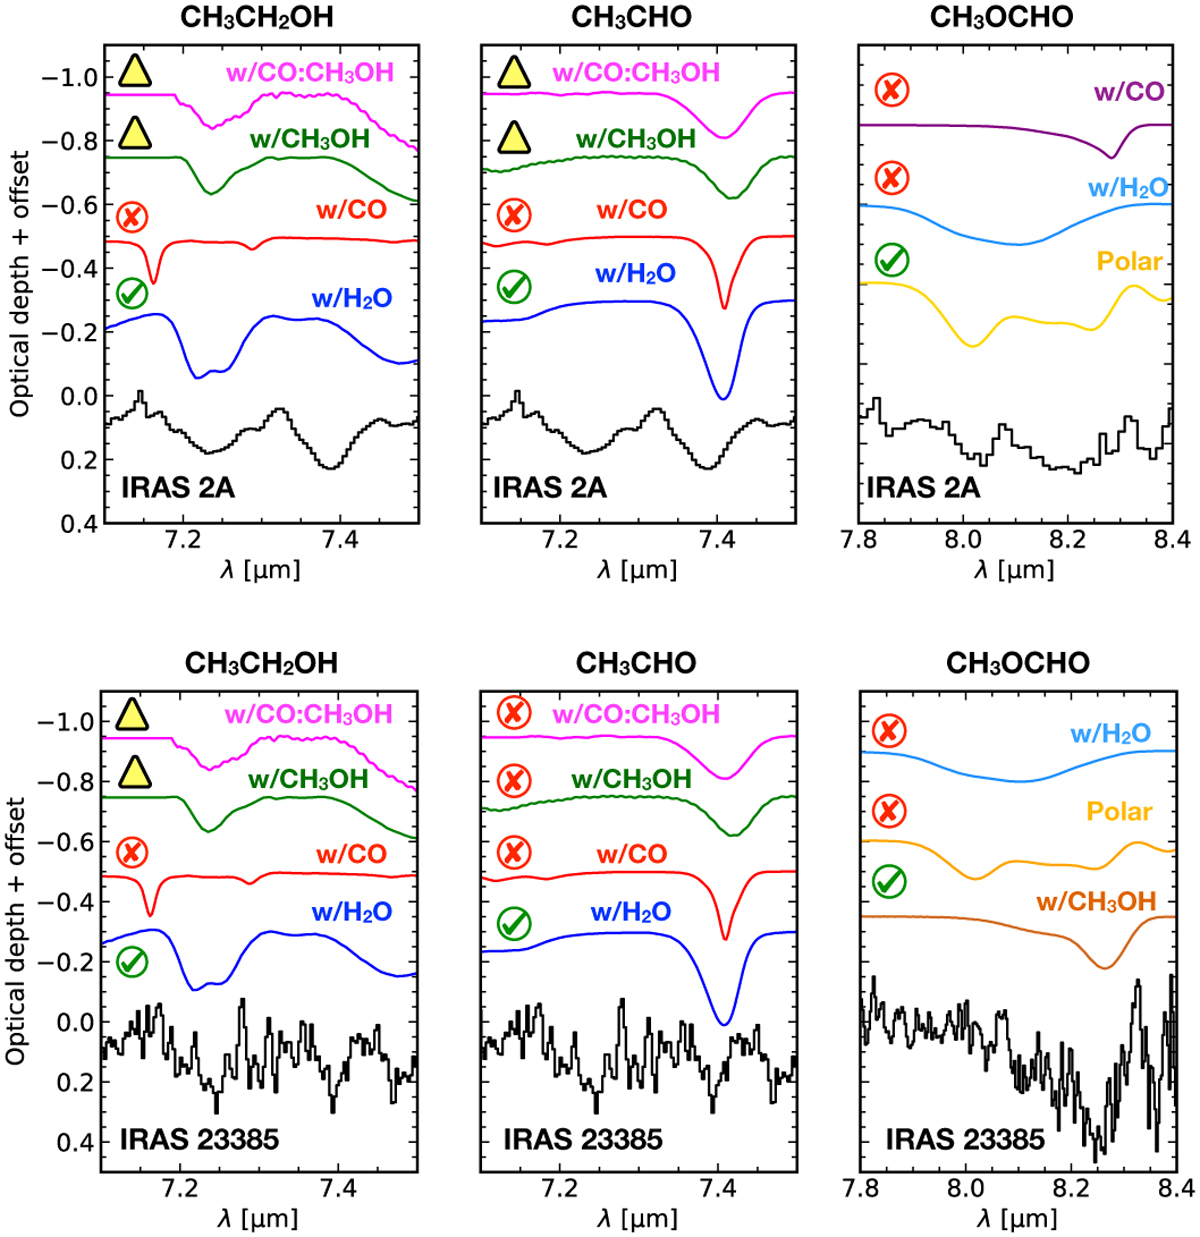
Fig. 13
Download original image
Comparisons between the IR spectra of COMs in different ice matrices with the observed bands of IRAS 2A (top) and IRAS 23385 (bottom). The green checkmarks indicate the data providing the best fit. Excluded data are given by the red cross. Data not part of the best fit and with lower recurrence are indicated by the yellow triangle. The term “polar” in the right panels refers to CO:H2CO:CH3OH and it is the original label published in Terwisscha van Scheltinga et al. (2021).
Current usage metrics show cumulative count of Article Views (full-text article views including HTML views, PDF and ePub downloads, according to the available data) and Abstracts Views on Vision4Press platform.
Data correspond to usage on the plateform after 2015. The current usage metrics is available 48-96 hours after online publication and is updated daily on week days.
Initial download of the metrics may take a while.