Fig. 12
Download original image
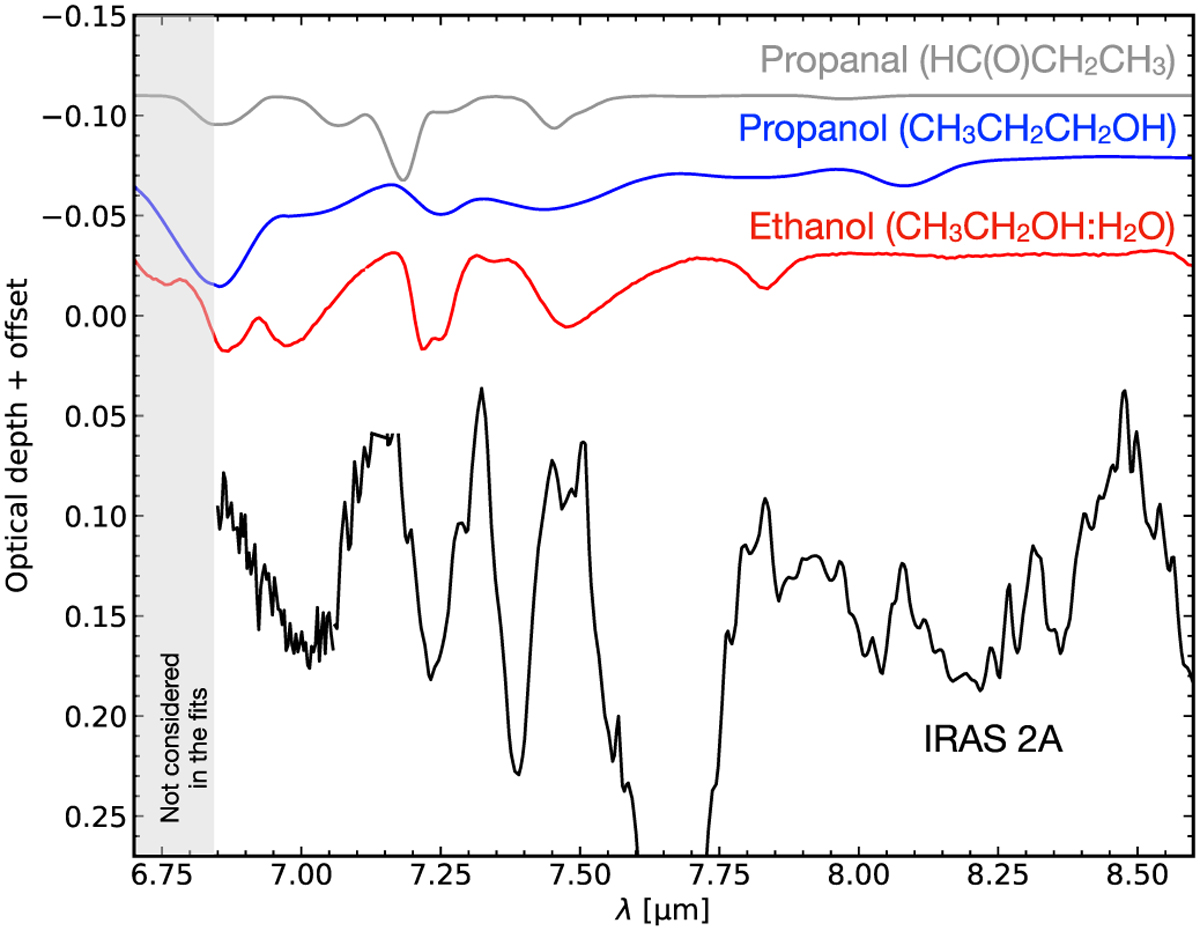
Experimental IR spectra of ethanol, propanal and propanol compared to IRAS 2A spectrum in the range between 6.8–8.6 µm. The grey area is not considered in the fits, but it is shown here to highlight the C–H stretching mode of these molecules. For better readability of this figure, the gas-phase emission lines between 6.8–7.2 µm are masked.
Current usage metrics show cumulative count of Article Views (full-text article views including HTML views, PDF and ePub downloads, according to the available data) and Abstracts Views on Vision4Press platform.
Data correspond to usage on the plateform after 2015. The current usage metrics is available 48-96 hours after online publication and is updated daily on week days.
Initial download of the metrics may take a while.