Fig. 10
Download original image
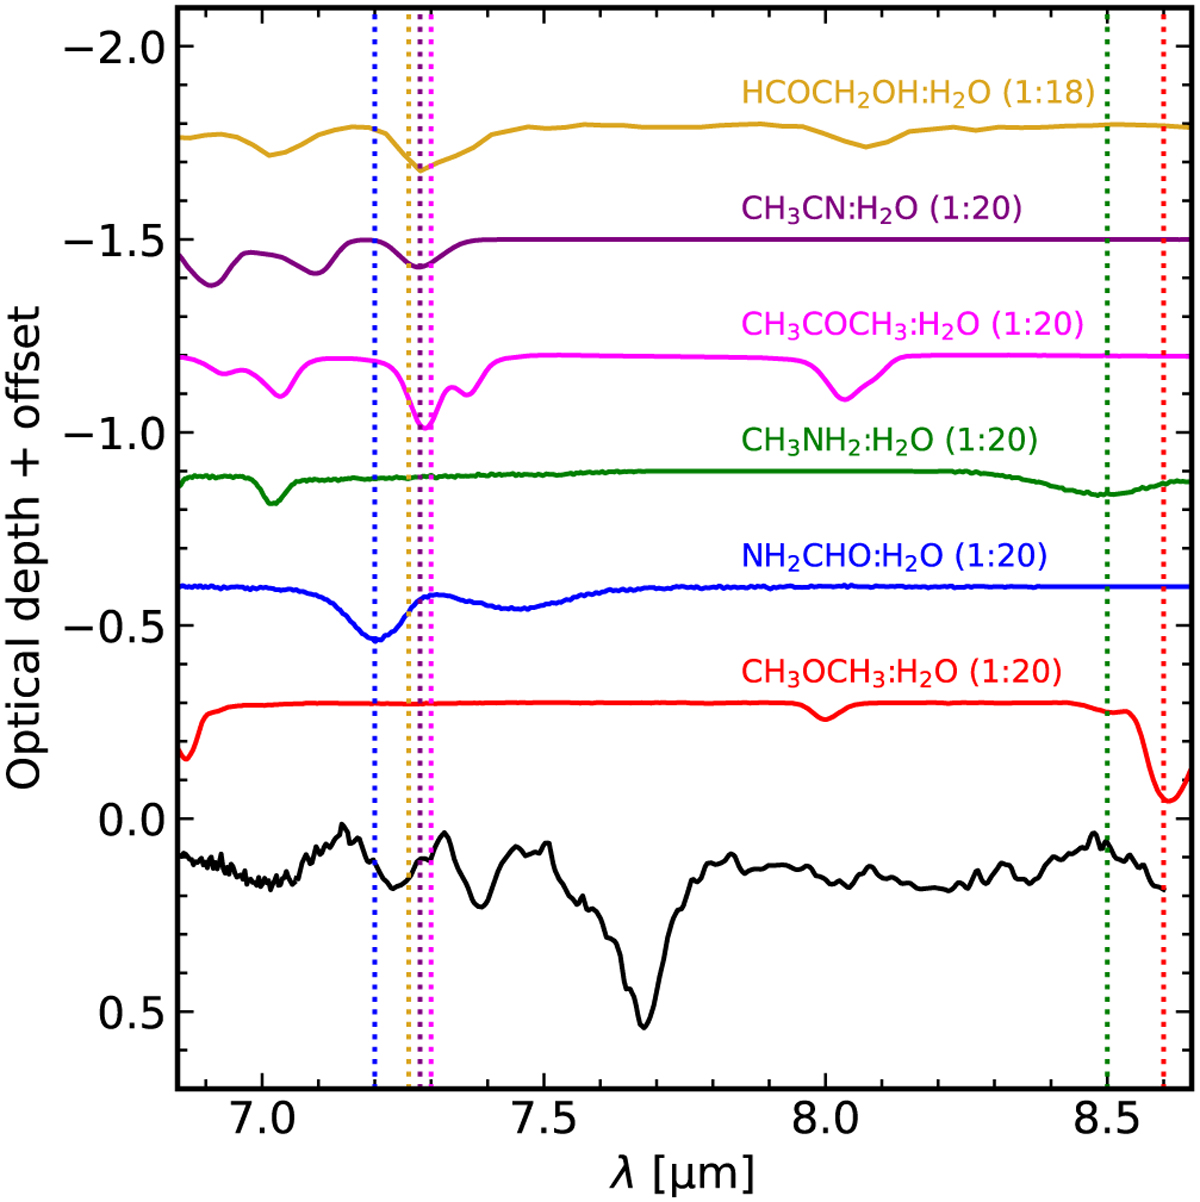
IR spectra of COMs not contributing to the global fit, but with absorption features in the range between 6.8 and 8.6 µm. These spectra are scaled to the IRAS 2A spectrum (black) to derive upper limit column densities. The vertical dotted lines are colour-coded and indicate the features used to derive the ice column densities. A small horizontal shift in the vertical lines is used to distinguish the bands at 7.3 µm.
Current usage metrics show cumulative count of Article Views (full-text article views including HTML views, PDF and ePub downloads, according to the available data) and Abstracts Views on Vision4Press platform.
Data correspond to usage on the plateform after 2015. The current usage metrics is available 48-96 hours after online publication and is updated daily on week days.
Initial download of the metrics may take a while.