Fig. 9.
Download original image
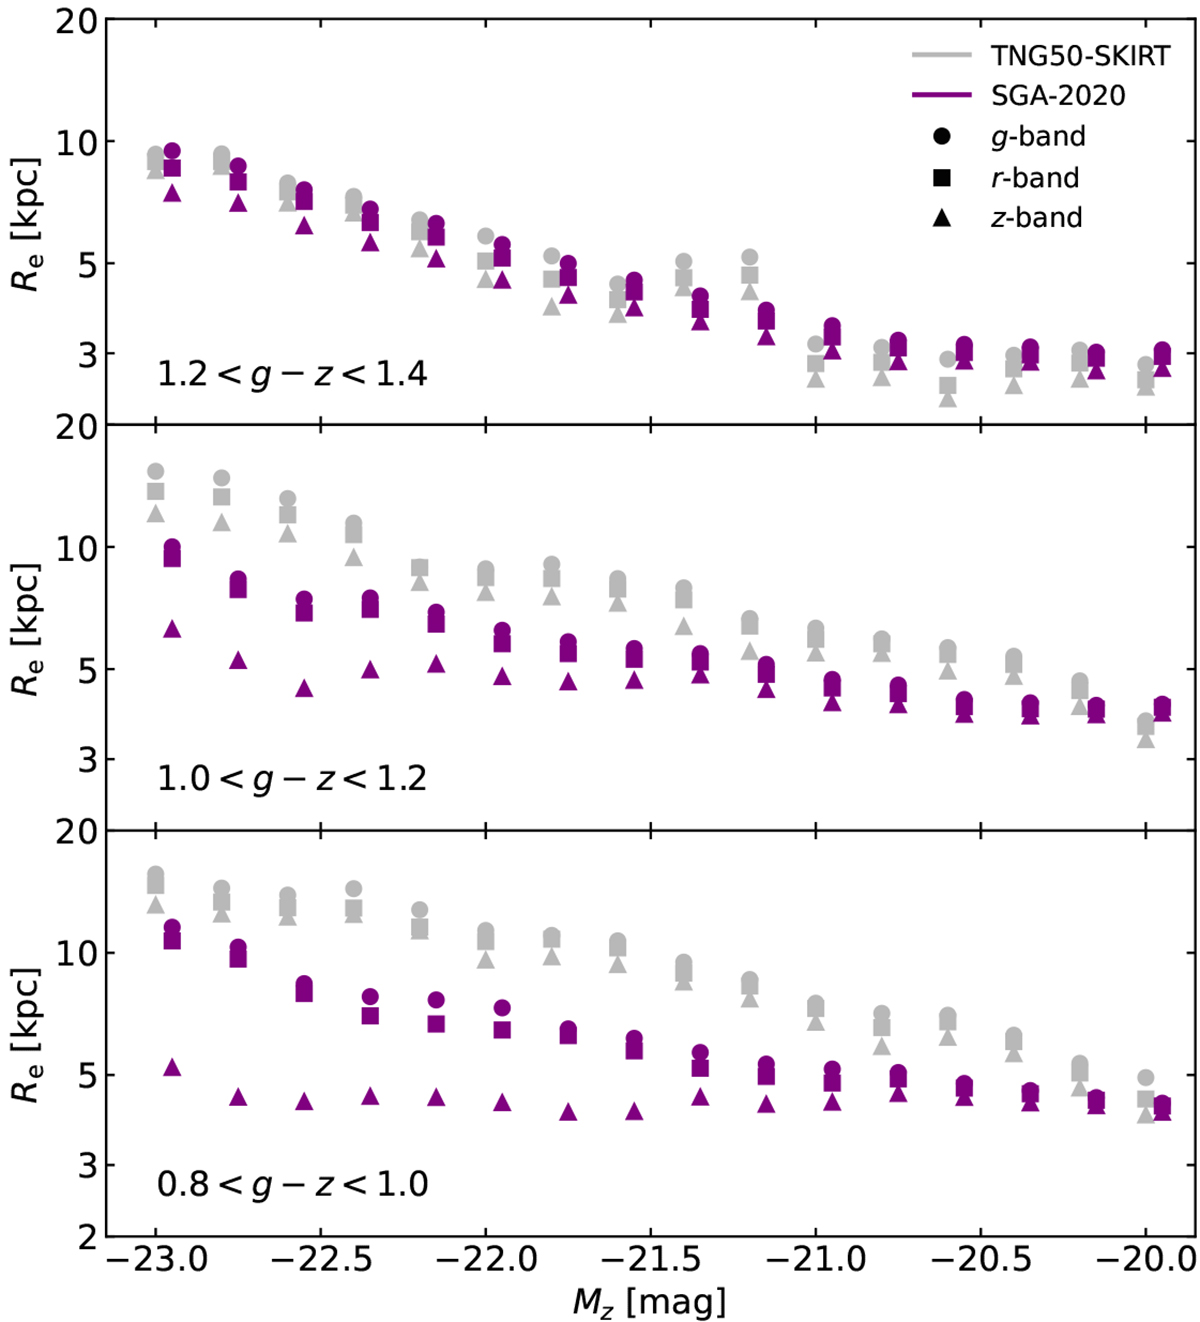
Comparison of the effective radii for our sample of simulated TSA galaxies to effective radii of galaxies from the Siena Galaxy Atlas 2020 (Moustakas et al. 2023). The three different panels correspond to different bins in g − z colour, and each symbol represents the median effective radius in a bin in z-band absolute magnitude of width ΔMz = 0.2. Measurements in the g-, r-, and z-bands are indicated by different symbols, as indicated in the top panel. The symbols for the SGA-2020 are plotted slightly offset for the sake of clarity.
Current usage metrics show cumulative count of Article Views (full-text article views including HTML views, PDF and ePub downloads, according to the available data) and Abstracts Views on Vision4Press platform.
Data correspond to usage on the plateform after 2015. The current usage metrics is available 48-96 hours after online publication and is updated daily on week days.
Initial download of the metrics may take a while.