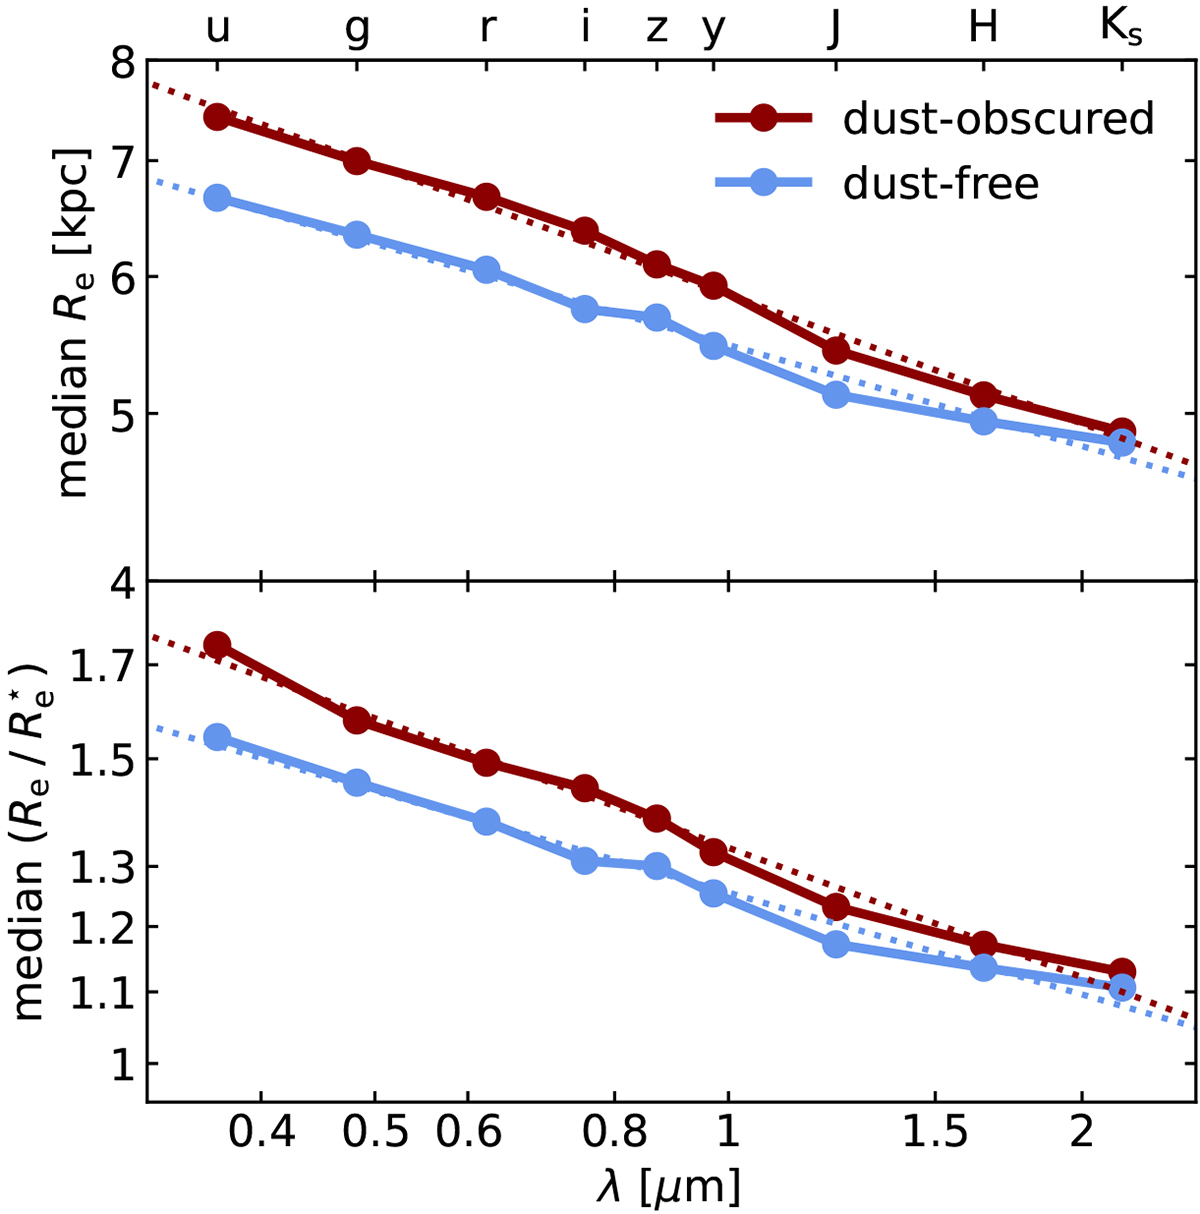
Fig. 7.
Download original image
Wavelength dependence of the effective radius for our sample of TNG50 galaxies. Top panel: median value of the half-light radius. Middle panel: median ratio of the half-light radius to the g-band half-light radius. Bottom panel: median ratio of the half-light radius and half-mass radius. In all three panels, the black lines and markers correspond to the dust-affected images, the blue ones to the dust-free images. The dotted lines represent power-law fits to the data points.
Current usage metrics show cumulative count of Article Views (full-text article views including HTML views, PDF and ePub downloads, according to the available data) and Abstracts Views on Vision4Press platform.
Data correspond to usage on the plateform after 2015. The current usage metrics is available 48-96 hours after online publication and is updated daily on week days.
Initial download of the metrics may take a while.