Fig. 5.
Download original image
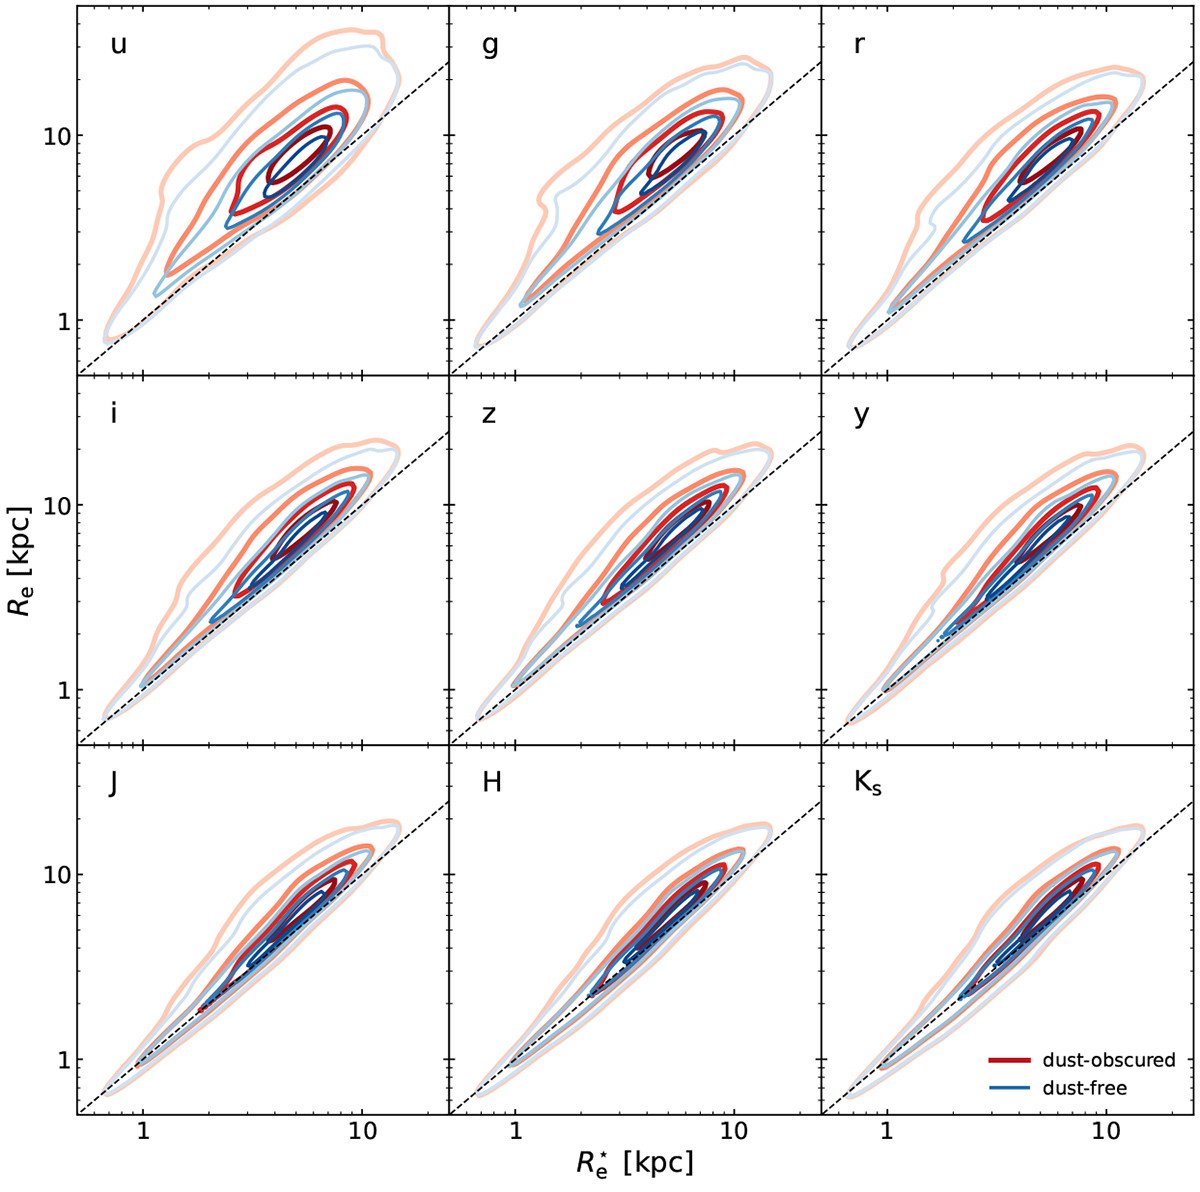
Comparison between the half-mass radius ![]() and the half-light radius Re in nine different optical–NIR broadband filters. Thick red contours correspond to measurements of Re from the dust-obscured images, slightly thinner blue contours to measurements from dust-free images. The contour correspond to the 10, 40, 70 and 90% percentile levels. The dashed lines represent a one-to-one relationship between
and the half-light radius Re in nine different optical–NIR broadband filters. Thick red contours correspond to measurements of Re from the dust-obscured images, slightly thinner blue contours to measurements from dust-free images. The contour correspond to the 10, 40, 70 and 90% percentile levels. The dashed lines represent a one-to-one relationship between ![]() and Re.
and Re.
Current usage metrics show cumulative count of Article Views (full-text article views including HTML views, PDF and ePub downloads, according to the available data) and Abstracts Views on Vision4Press platform.
Data correspond to usage on the plateform after 2015. The current usage metrics is available 48-96 hours after online publication and is updated daily on week days.
Initial download of the metrics may take a while.