Fig. 3.
Download original image
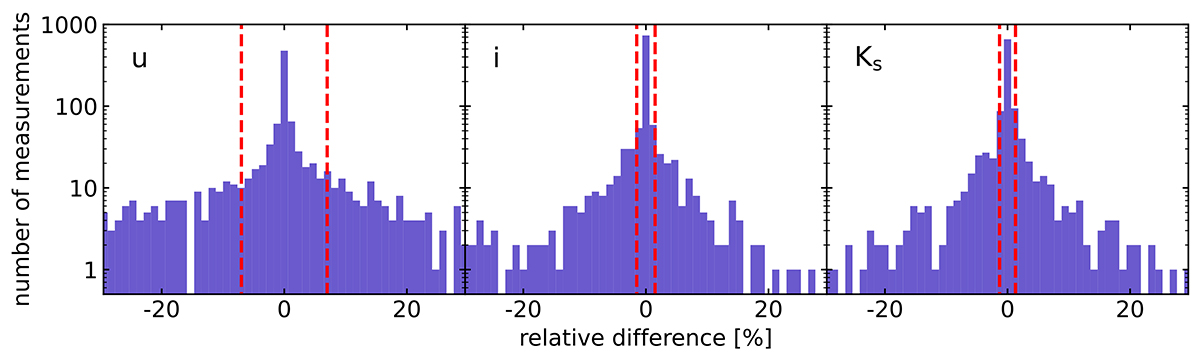
Histograms of the relative difference between the effective radius measured from the antipodal O4 and O5 observer positions in the LSST u- and i-bands and the 2MASS Ks-band. The dashed red lines represent the 16% and 86% quantiles of the distribution. Half of the width of this confidence interval can be used as an upper limit for the relative uncertainty on our Re measurements.
Current usage metrics show cumulative count of Article Views (full-text article views including HTML views, PDF and ePub downloads, according to the available data) and Abstracts Views on Vision4Press platform.
Data correspond to usage on the plateform after 2015. The current usage metrics is available 48-96 hours after online publication and is updated daily on week days.
Initial download of the metrics may take a while.