Fig. 2.
Download original image
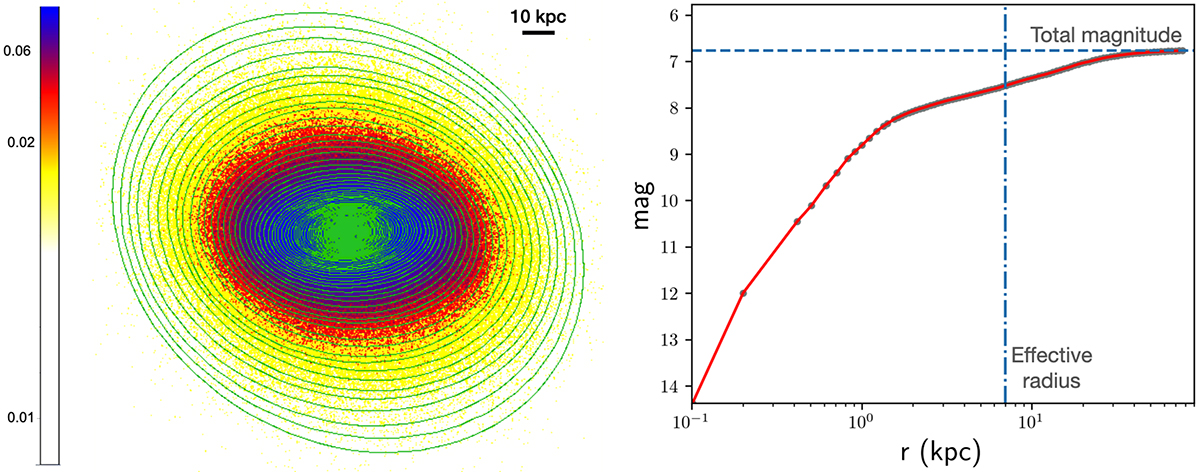
Illustration of the curve-of-growth analysis described in Sect. 2.2, here applied to the 2MASS H-band image of simulated galaxy TNG 000001 in orientation O1. The 2D surface brightness distribution is fitted with a series of concentric ellipses, and the total integrated flux within each ellipse is determined. The effective radius is the semi-major axis of the ellipse that contains half of the total flux.
Current usage metrics show cumulative count of Article Views (full-text article views including HTML views, PDF and ePub downloads, according to the available data) and Abstracts Views on Vision4Press platform.
Data correspond to usage on the plateform after 2015. The current usage metrics is available 48-96 hours after online publication and is updated daily on week days.
Initial download of the metrics may take a while.