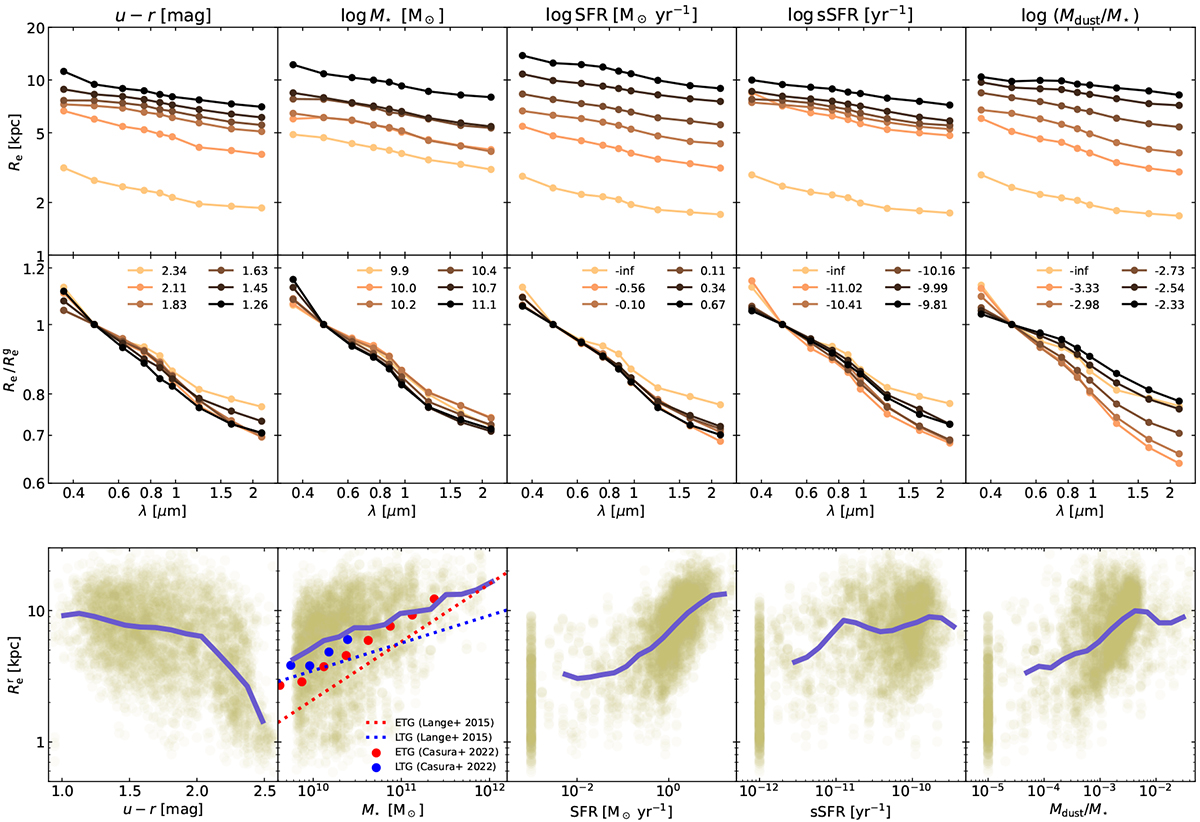
Fig. 10.
Download original image
Dependence of the effective radius on global physical properties. Each column corresponds to a different global physical property: u − r colour, stellar mass, star formation rate, specific star formation rate, and specific dust mass. The entire sample is split into six subpopulations based on each of these properties. Top row: median effective radius for each subpopulation. Middle row: median ratio of the effective radius and the g-band effective radius. Bottom row: scatter plots relating the physical property to the g-band effective radius. All TNG50 galaxies without ongoing star-formation are plotted at SFR = 10−3 M⊙ yr−1 and sSFR = 10−12 yr−1, and all dust-free galaxies at Mdust/M⋆ = 10−5. The blue curves represent running medians.
Current usage metrics show cumulative count of Article Views (full-text article views including HTML views, PDF and ePub downloads, according to the available data) and Abstracts Views on Vision4Press platform.
Data correspond to usage on the plateform after 2015. The current usage metrics is available 48-96 hours after online publication and is updated daily on week days.
Initial download of the metrics may take a while.