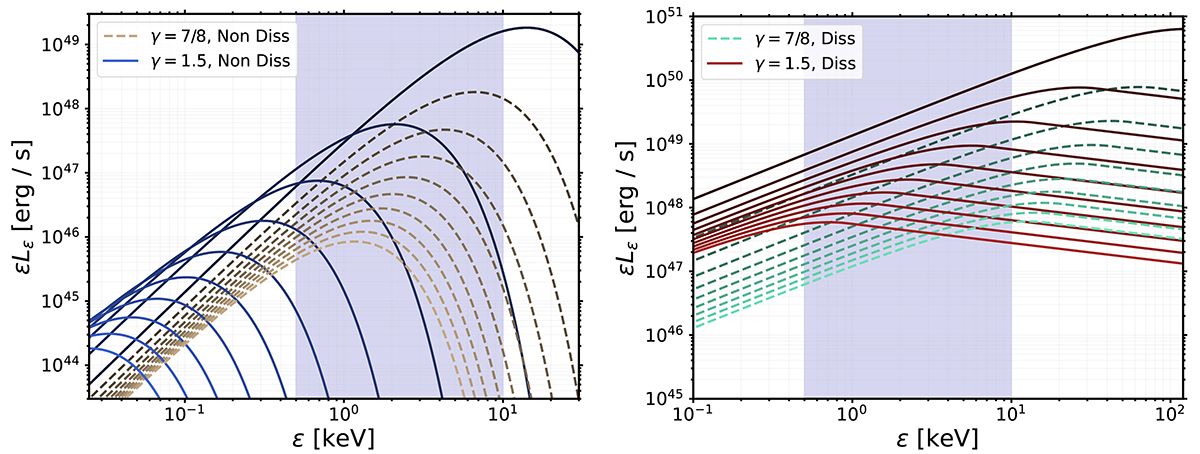
Fig. 1.
Download original image
Snapshot spectra showing the evolution of the spectral luminosity during the ESD in the non-dissipative scenario (left) and the dissipative scenario (right). Dashed lines have γ = 7/8, while solid lines have γ = 1.5, as also indicated in the figure. The spectra are plotted at even intervals in time from the onset of the ESD at t/tb = 1 (dark colour) until t/tb = 10 (bright colour). Note that the two spectra for γ = 7/8 and γ = 1.5 overlap at t/tb = 1. The purple shading indicates the energy sensitivity of XRT. Parameter values used are given in Table 1.
Current usage metrics show cumulative count of Article Views (full-text article views including HTML views, PDF and ePub downloads, according to the available data) and Abstracts Views on Vision4Press platform.
Data correspond to usage on the plateform after 2015. The current usage metrics is available 48-96 hours after online publication and is updated daily on week days.
Initial download of the metrics may take a while.