Fig. 10.
Download original image
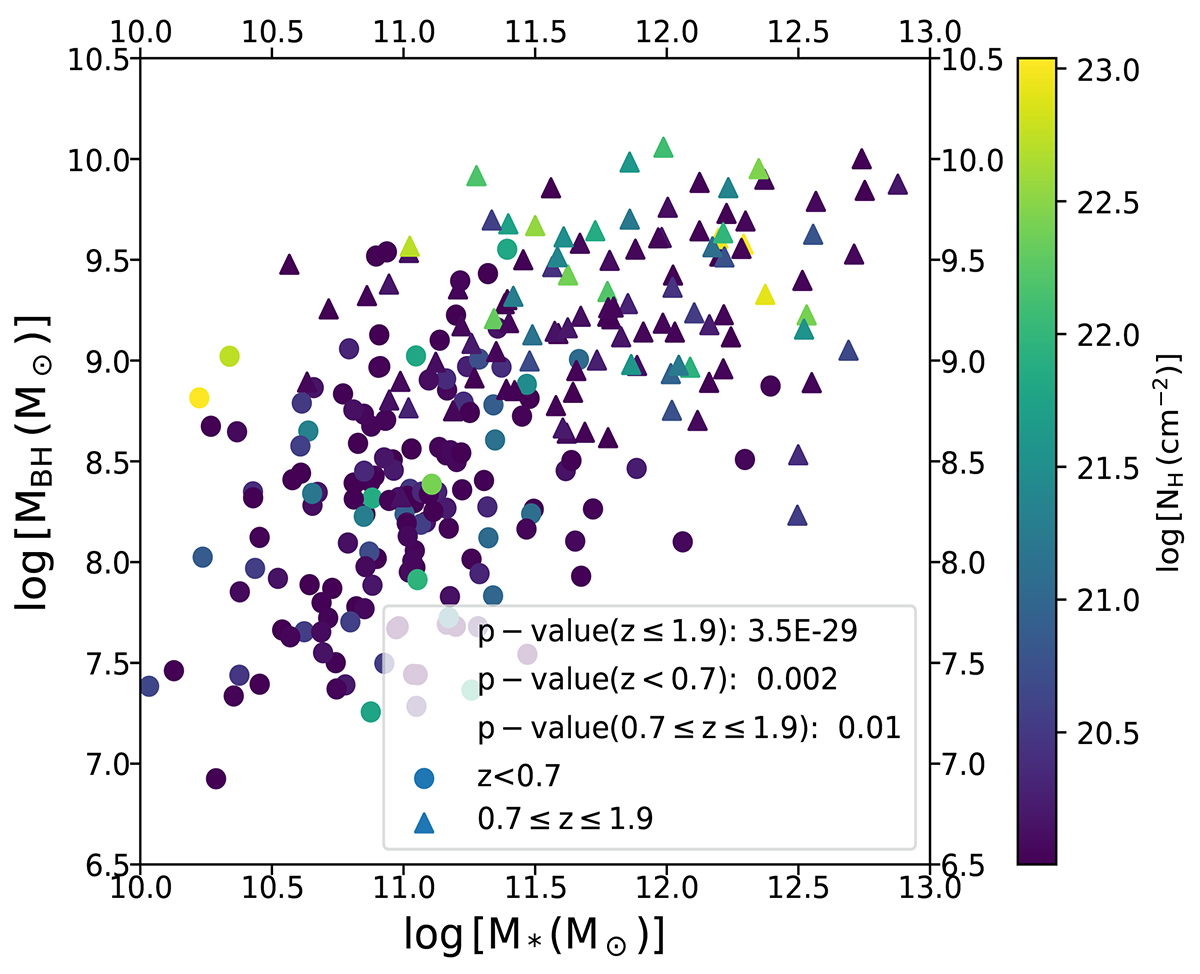
Black hole mass, MBH, as a function of M*. Different symbols correspond to different redshift bins, as indicated in the legend. The p-values obtained by applying a Spearman correlation analysis for the full redshift range (z < 1.9) as well as at low redshift (z < 0.7) and high redshift (0.7 < z < 1.9) are also shown. Measurements are colour-coded based on the NH of each source.
Current usage metrics show cumulative count of Article Views (full-text article views including HTML views, PDF and ePub downloads, according to the available data) and Abstracts Views on Vision4Press platform.
Data correspond to usage on the plateform after 2015. The current usage metrics is available 48-96 hours after online publication and is updated daily on week days.
Initial download of the metrics may take a while.