Fig. B.1.
Download original image
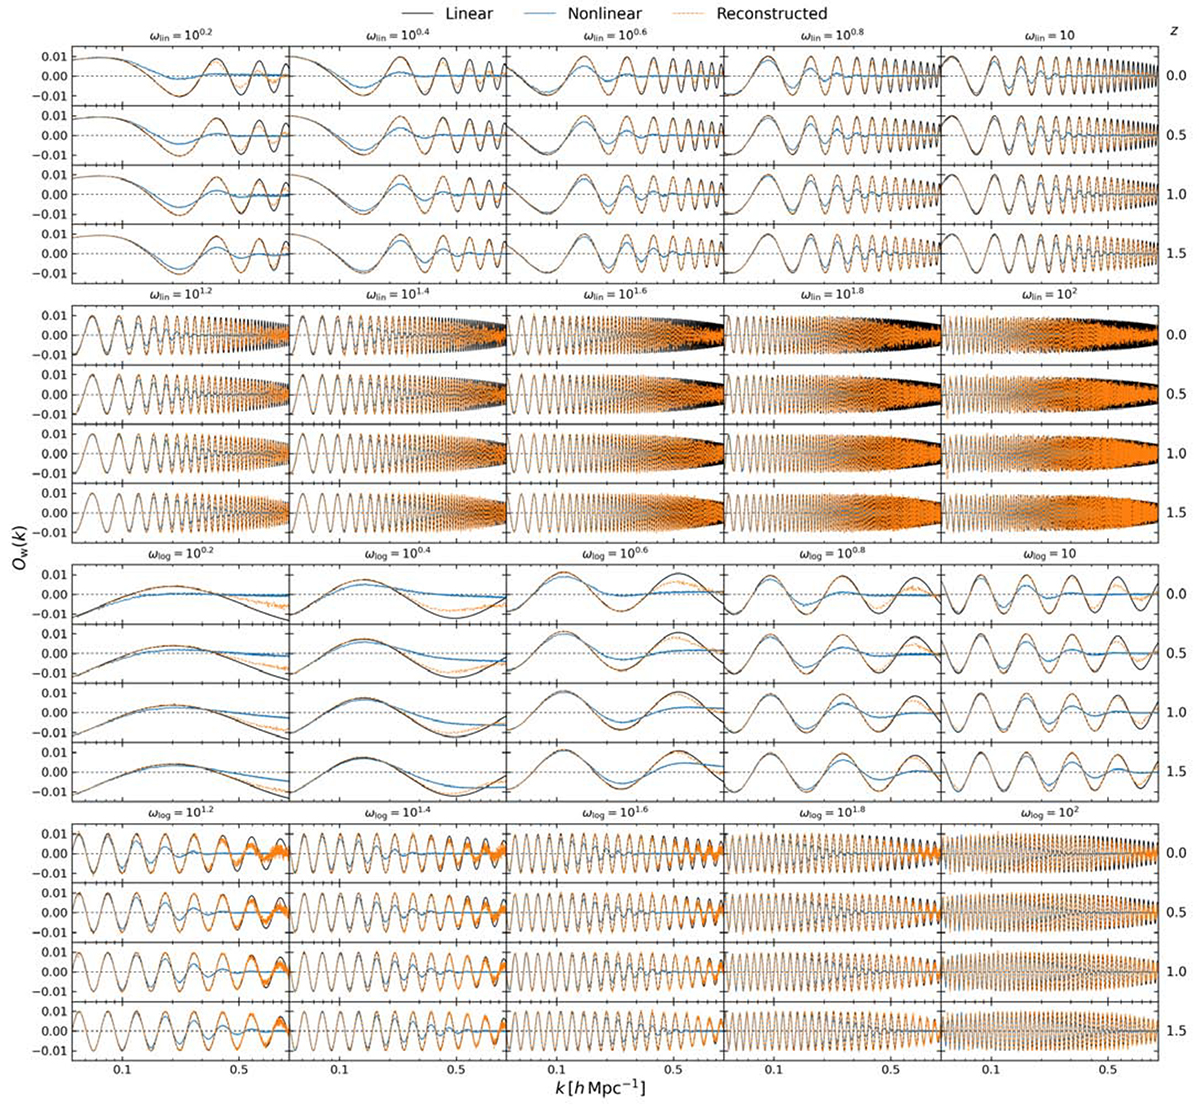
Ratio of the linear (black solid curves), nonlinear (blue solid curves), and reconstructed (orange dashed curves) density fields for the 20 selected feature models to the one obtained with a power-law PPS. Each of the rows is respectively for the redshifts marked on the right. The linear Ow(k) are measured from the initial conditions at z = 9, the nonlinear Ow(k) are from the output snapshots of DM, and the reconstructed Ow(k) are from the reconstructed density fields.
Current usage metrics show cumulative count of Article Views (full-text article views including HTML views, PDF and ePub downloads, according to the available data) and Abstracts Views on Vision4Press platform.
Data correspond to usage on the plateform after 2015. The current usage metrics is available 48-96 hours after online publication and is updated daily on week days.
Initial download of the metrics may take a while.