Fig. 6
Download original image
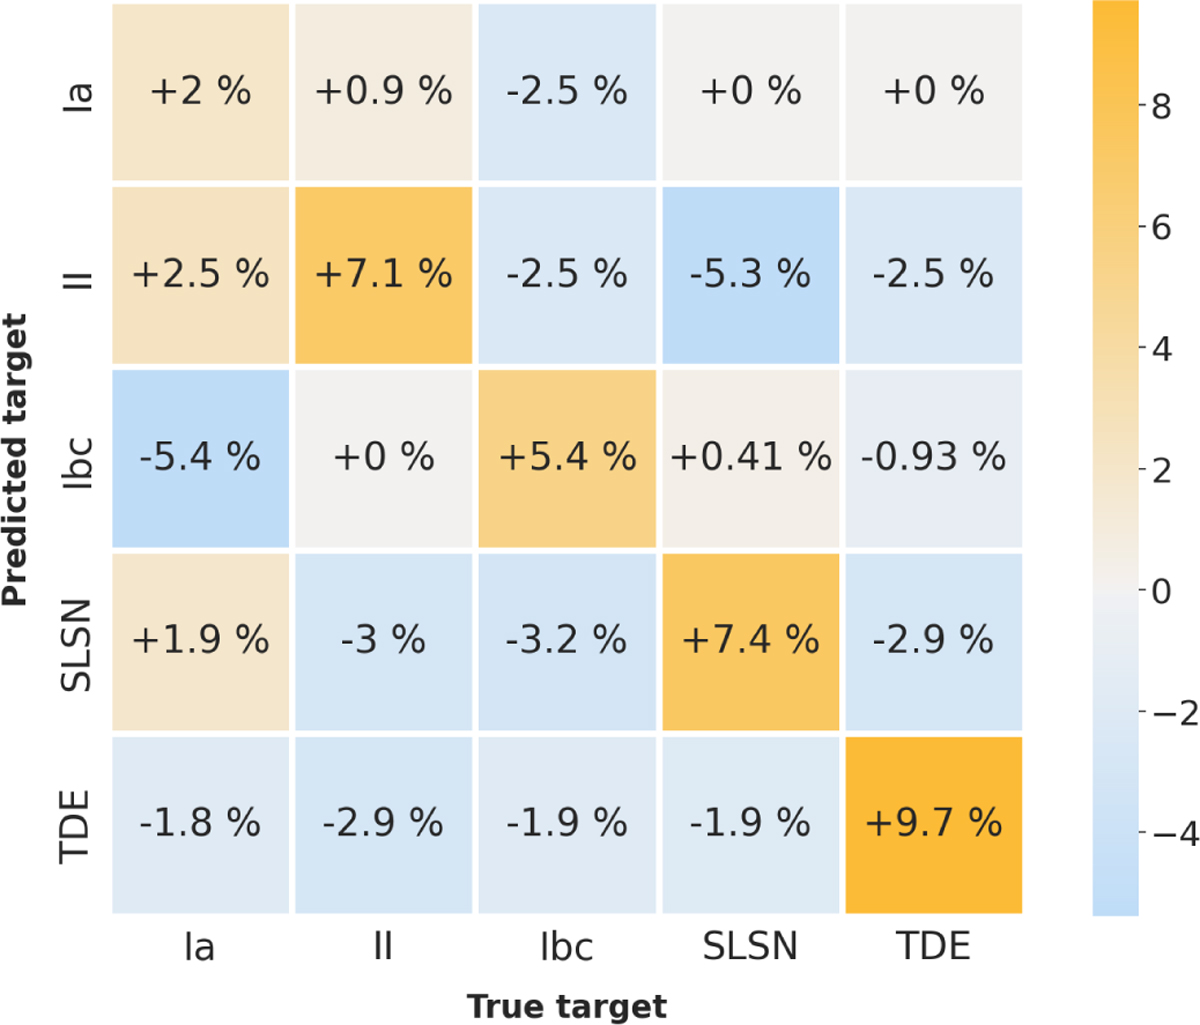
Confusion matrix difference between the random forest classifiers trained on RAINBOW and MONOCHROMATIC features (normalized on precision). The dataset is composed of 300 light curves of each class (SNIa, SNII, SNIbc, SLSN, and TDE). The numbers represent the difference (RAINBOW – MONOCHROMATIC) in the median score of 100 iterations of bootstrapping. Individual confusion matrices for each method are given in Appendix B (Figs. B.1 and B.2).
Current usage metrics show cumulative count of Article Views (full-text article views including HTML views, PDF and ePub downloads, according to the available data) and Abstracts Views on Vision4Press platform.
Data correspond to usage on the plateform after 2015. The current usage metrics is available 48-96 hours after online publication and is updated daily on week days.
Initial download of the metrics may take a while.