Fig. 5
Download original image
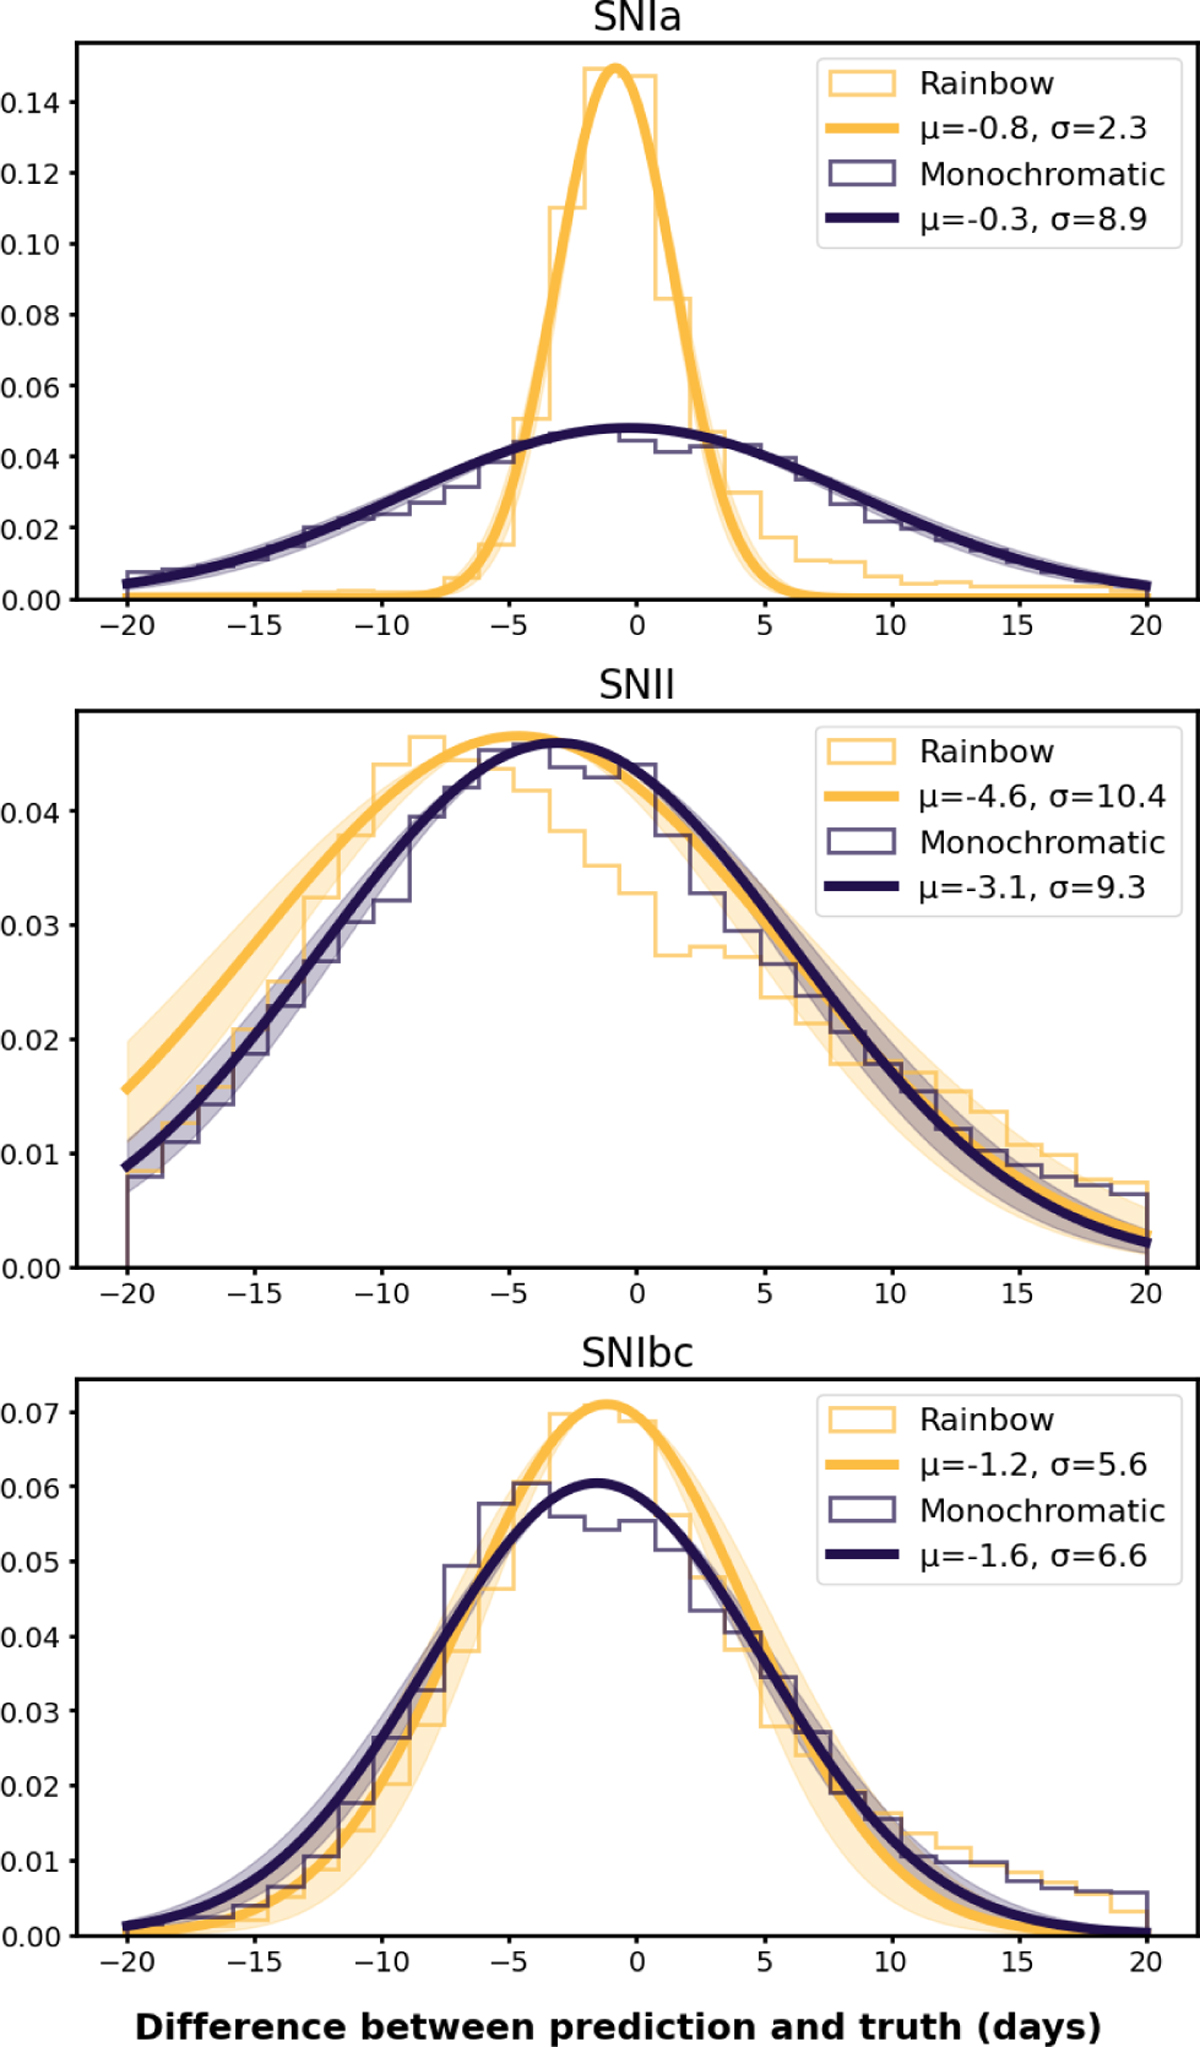
Distribution per class of SNe of the difference between the prediction and true time of maximum as given within the PLAsTiCC metadata. The predictions have been computed based on linear regressor models trained with RAINBOW (yellow) and MONOCHROMATIC (dark blue) features. Additionally, a Gaussian was fit to the distributions to evaluate its mean and standard deviation.
Current usage metrics show cumulative count of Article Views (full-text article views including HTML views, PDF and ePub downloads, according to the available data) and Abstracts Views on Vision4Press platform.
Data correspond to usage on the plateform after 2015. The current usage metrics is available 48-96 hours after online publication and is updated daily on week days.
Initial download of the metrics may take a while.