Open Access
Fig. 2
Download original image
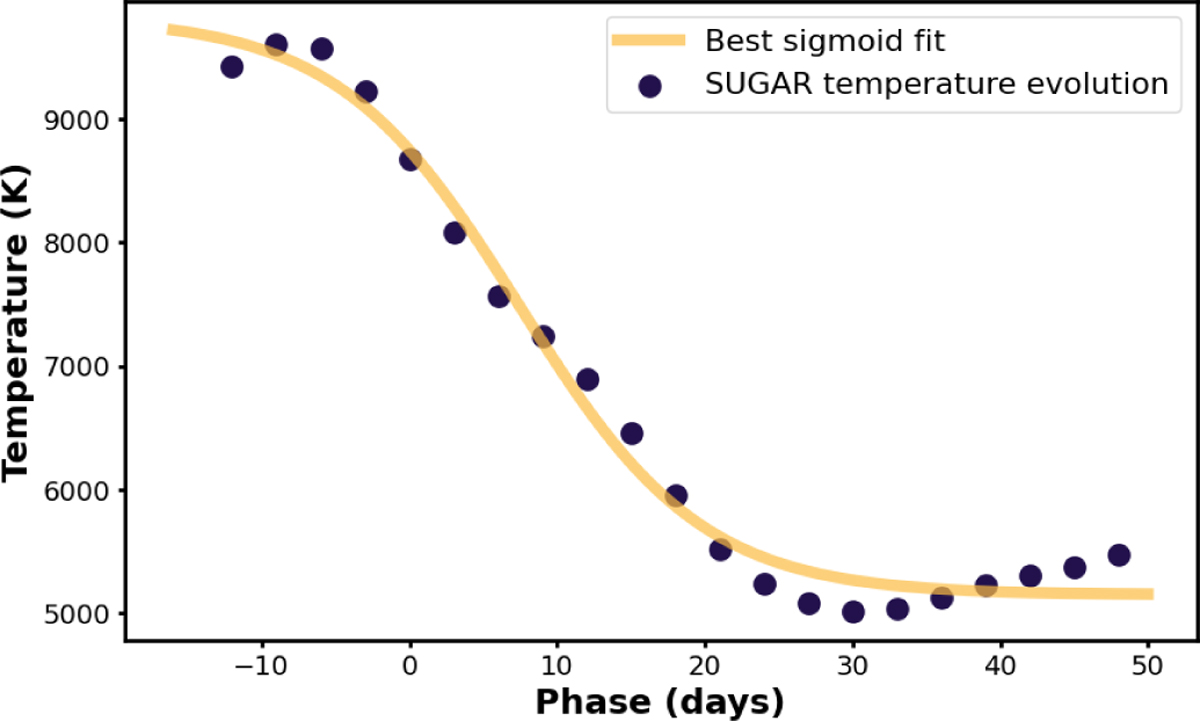
Best logistic function fit of temperature evolution extrapolated from the SUGAR model. The data points have been computed by fitting blackbodies to the SNIa spectra from 3250 to 8650 Å at regular time intervals. The phase corresponds to the time since maximum brightness.
Current usage metrics show cumulative count of Article Views (full-text article views including HTML views, PDF and ePub downloads, according to the available data) and Abstracts Views on Vision4Press platform.
Data correspond to usage on the plateform after 2015. The current usage metrics is available 48-96 hours after online publication and is updated daily on week days.
Initial download of the metrics may take a while.