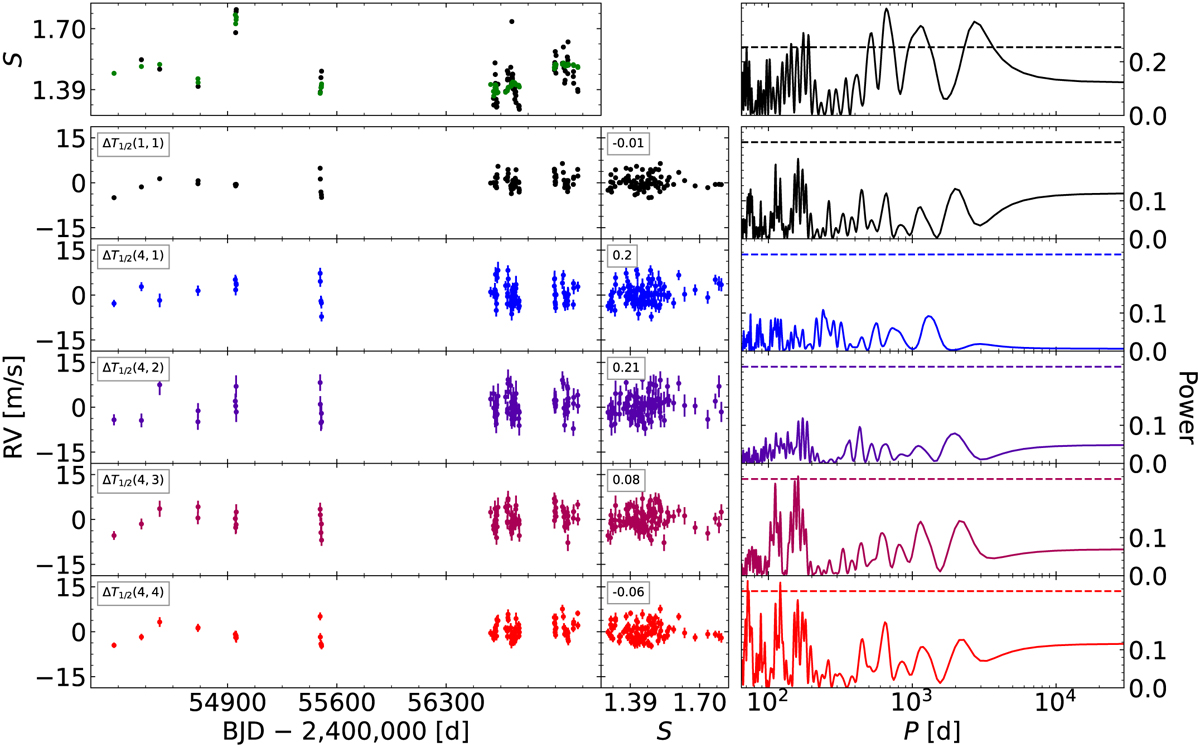
Fig. A.1

Download original image
Time series and GLS periodograms of Gl 229. Left: Time series of the S index (first row), the RV computed for 1 formation temperature bin (second row), and the RV computed for four formation temperature bins (third to sixth row, in order of the coolest to hottest bin). For the S index, black points show nightly binned values and green points show nightly binned values smoothed with a 200-day rolling average. Middle: Correlations between the unsmoothed S index and corresponding RVs from the left panels. The Pearson correlation coefficients, which are summarized in Fig. 3, are shown in the upper left corners. Right: GLS periodograms of the S index and RVs from the left panels. The dashed lines show the corresponding 0.01% FAP levels.
Current usage metrics show cumulative count of Article Views (full-text article views including HTML views, PDF and ePub downloads, according to the available data) and Abstracts Views on Vision4Press platform.
Data correspond to usage on the plateform after 2015. The current usage metrics is available 48-96 hours after online publication and is updated daily on week days.
Initial download of the metrics may take a while.


