Fig. 4
Download original image
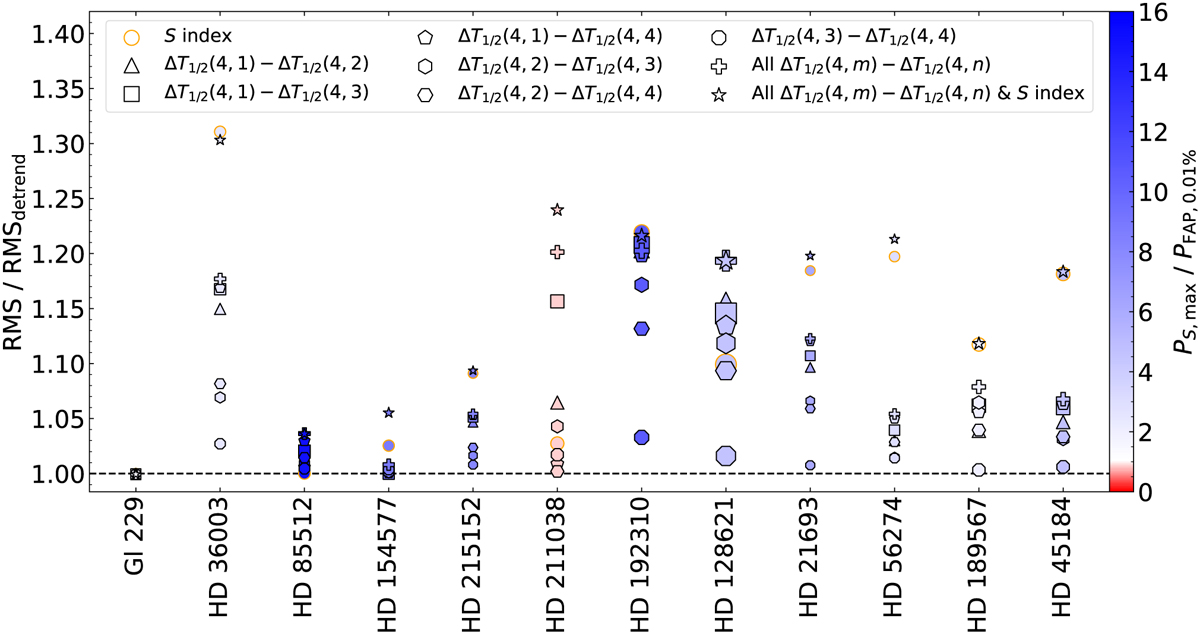
RMS improvement of the ∆T1/2(1,1) RV time series after linear detrending with different proxies. The markers represent detrending with either the S index alone (circles with orange edges), different 4-bin residuals (convex polygons with black edges), a multi-linear combination of all 4-bin residuals (crosses), or a multi-linear combination of all 4-bin residuals and the S index (stars). The marker sizes and colors indicate the same properties as described in Fig. 3.
Current usage metrics show cumulative count of Article Views (full-text article views including HTML views, PDF and ePub downloads, according to the available data) and Abstracts Views on Vision4Press platform.
Data correspond to usage on the plateform after 2015. The current usage metrics is available 48-96 hours after online publication and is updated daily on week days.
Initial download of the metrics may take a while.