Fig. 3
Download original image
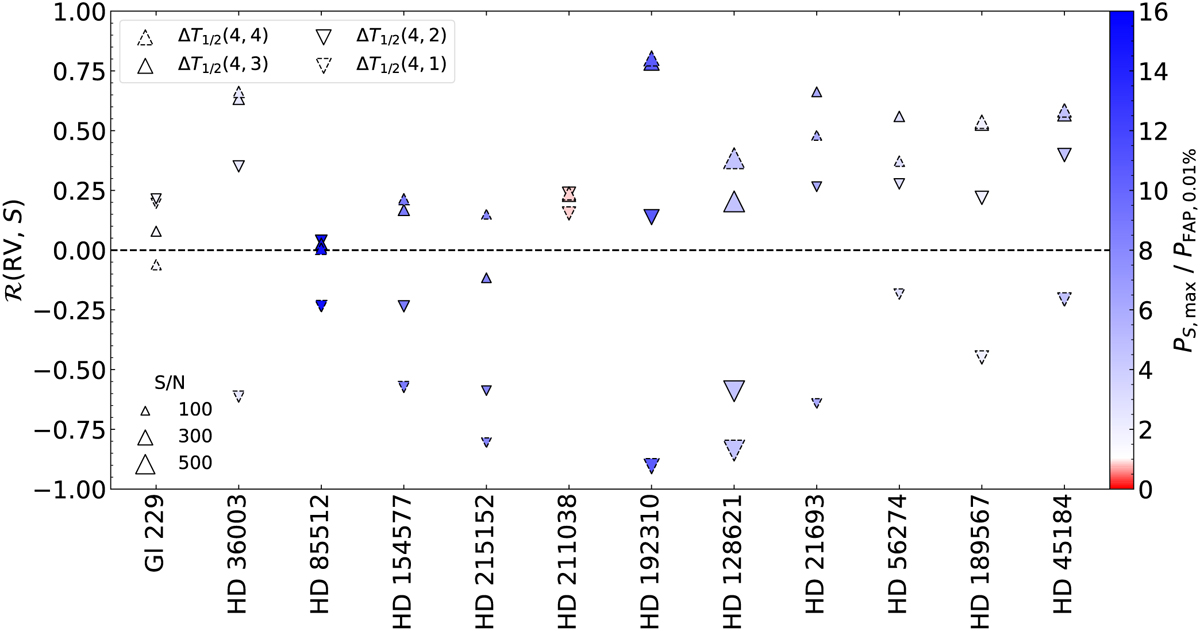
Pearson correlation, ℛ, between the temperature-binned RVs and the S index. The stars are ordered by effective temperature. The marker size indicates the median S/N of the studied spectra of each star, and the marker color indicates the power, P, of the largest periodogram peak of the S index relative to its 0.01% FAP level. The color map inverts at 1, such that green points represent periodograms peaks above the 0.01% FAP, and red points represent peaks below it.
Current usage metrics show cumulative count of Article Views (full-text article views including HTML views, PDF and ePub downloads, according to the available data) and Abstracts Views on Vision4Press platform.
Data correspond to usage on the plateform after 2015. The current usage metrics is available 48-96 hours after online publication and is updated daily on week days.
Initial download of the metrics may take a while.