Fig. 1
Download original image
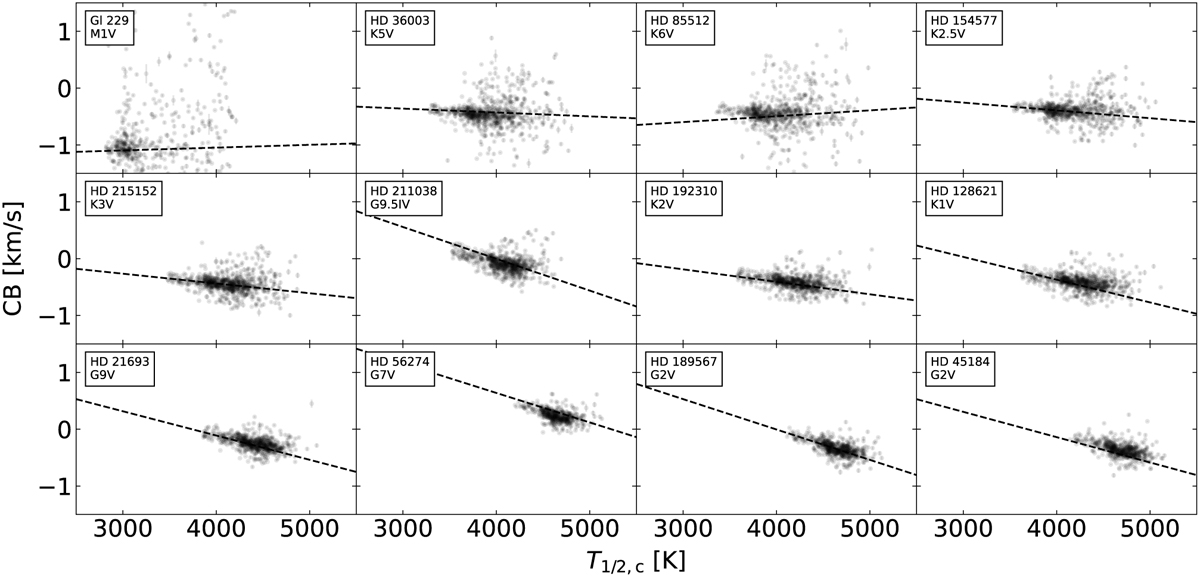
CB as a function of formation temperature at the line cores, T1/2,c, for the stellar sample. The stars and their spectral types are labeled in the upper left corner of each subplot, and ordered by effective temperature, from left to right and top to bottom. For most stars, the CB shows a linear trend with T1/2,c, indicating that lines formed at higher temperatures, i.e., deeper layers of the photosphere where convective motion is stronger, are subject to larger velocity shifts. The individual spectral lines are shown as points and the fitted linear trends are shown as dashed lines.
Current usage metrics show cumulative count of Article Views (full-text article views including HTML views, PDF and ePub downloads, according to the available data) and Abstracts Views on Vision4Press platform.
Data correspond to usage on the plateform after 2015. The current usage metrics is available 48-96 hours after online publication and is updated daily on week days.
Initial download of the metrics may take a while.