Open Access
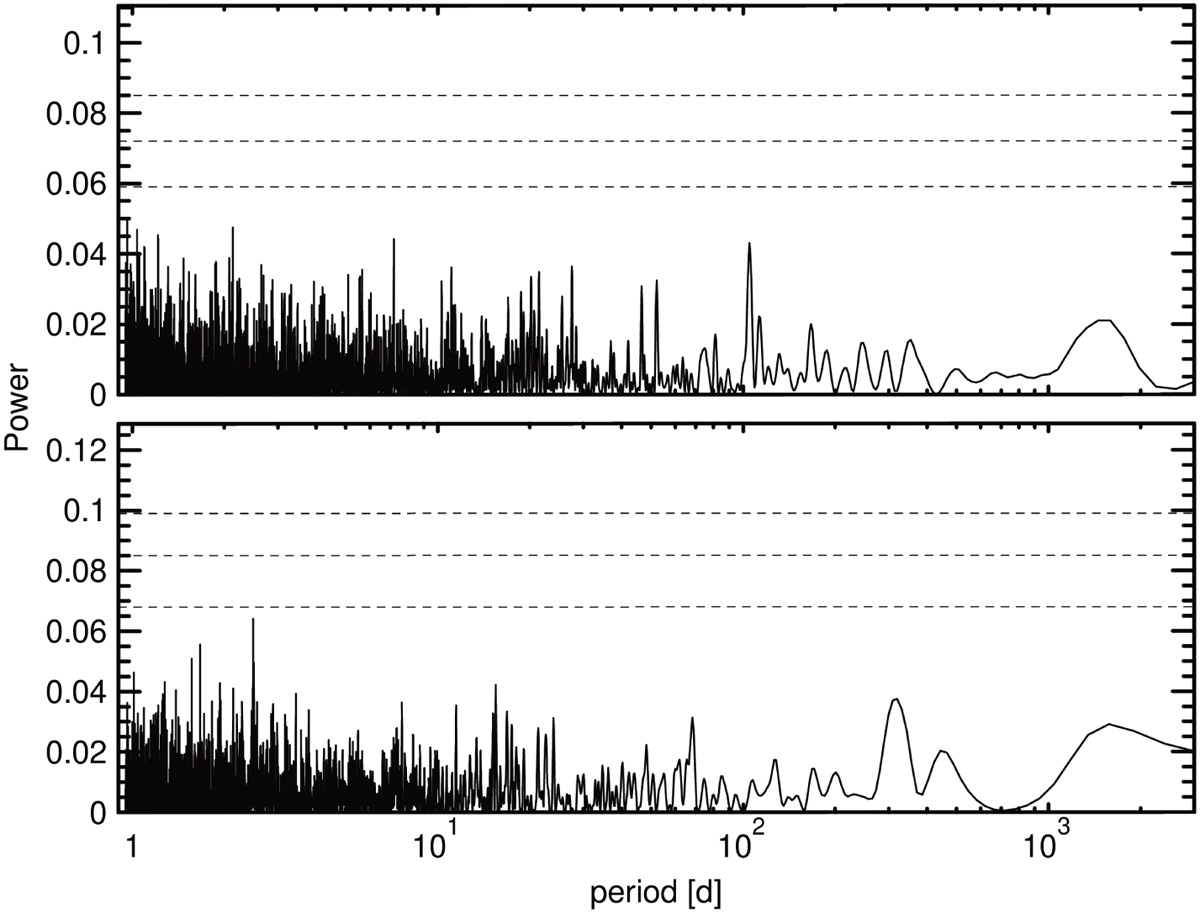
Fig. A.3
Download original image
Periodogram of the ASAS and ASAS-SN V-band photometry of TIC 4672985 (upper and lower panel, respectively). The dashed horizontal lines correspond to 10%, 1% and 0.1% false-alarm probability (from bottom to top).
Current usage metrics show cumulative count of Article Views (full-text article views including HTML views, PDF and ePub downloads, according to the available data) and Abstracts Views on Vision4Press platform.
Data correspond to usage on the plateform after 2015. The current usage metrics is available 48-96 hours after online publication and is updated daily on week days.
Initial download of the metrics may take a while.