Fig. 14
Download original image
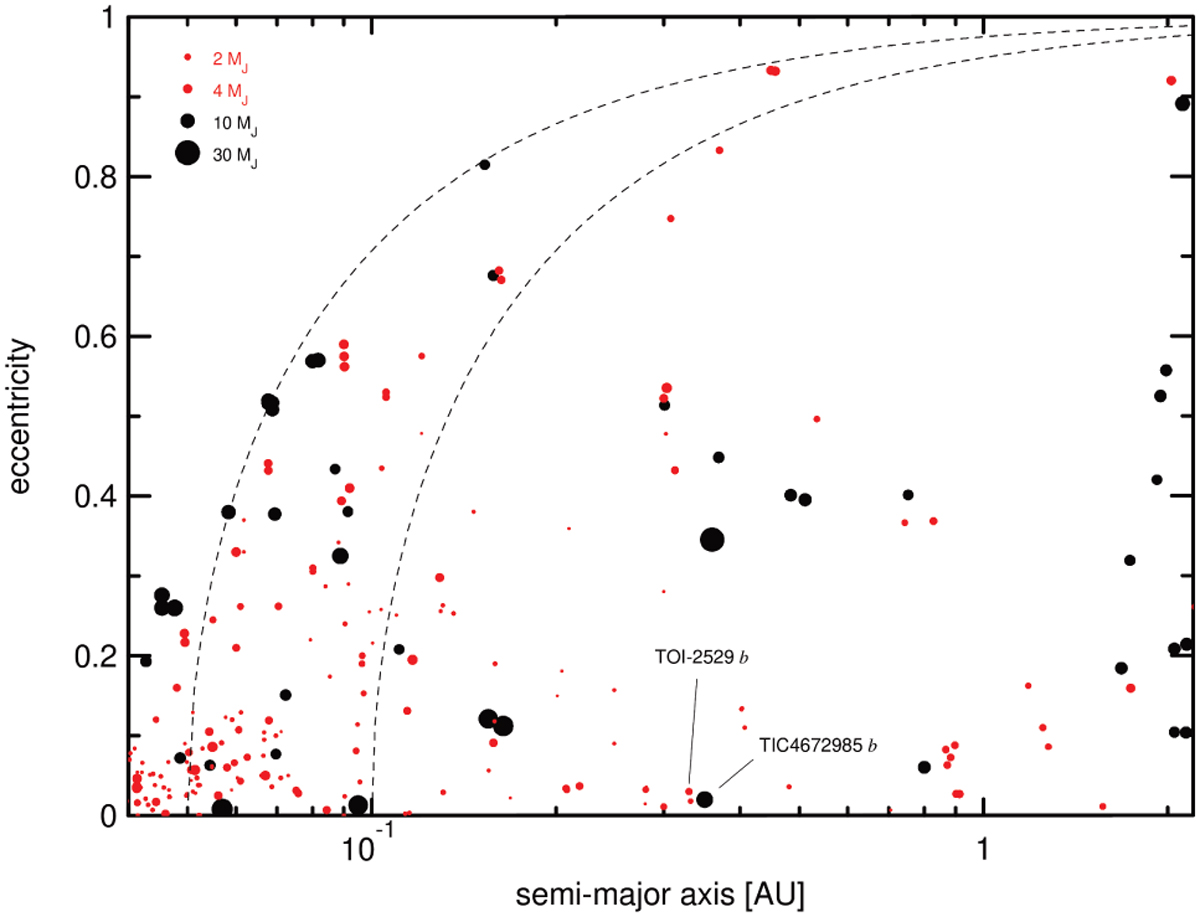
Eccentricity distribution as a function of the orbital distance for known giant planets with eccentricity precision of σe < 0.15 and mass precision better than 20%, including TIC 4672985 b and TOI-2529 b. The size of the symbols is proportional to the square of the planet’s mass. For more clarity, we split the data into two populations, with masses below and above 5 MJ (red and black dots, respectively). The dotted lines correspond to high-eccentricity migration pathways at constant angular momentum (e.g. Dong et al. 2021), with final orbital distance of 0.05 and 0.10 AU (left and right curves, respectively).
Current usage metrics show cumulative count of Article Views (full-text article views including HTML views, PDF and ePub downloads, according to the available data) and Abstracts Views on Vision4Press platform.
Data correspond to usage on the plateform after 2015. The current usage metrics is available 48-96 hours after online publication and is updated daily on week days.
Initial download of the metrics may take a while.