Fig. 12
Download original image
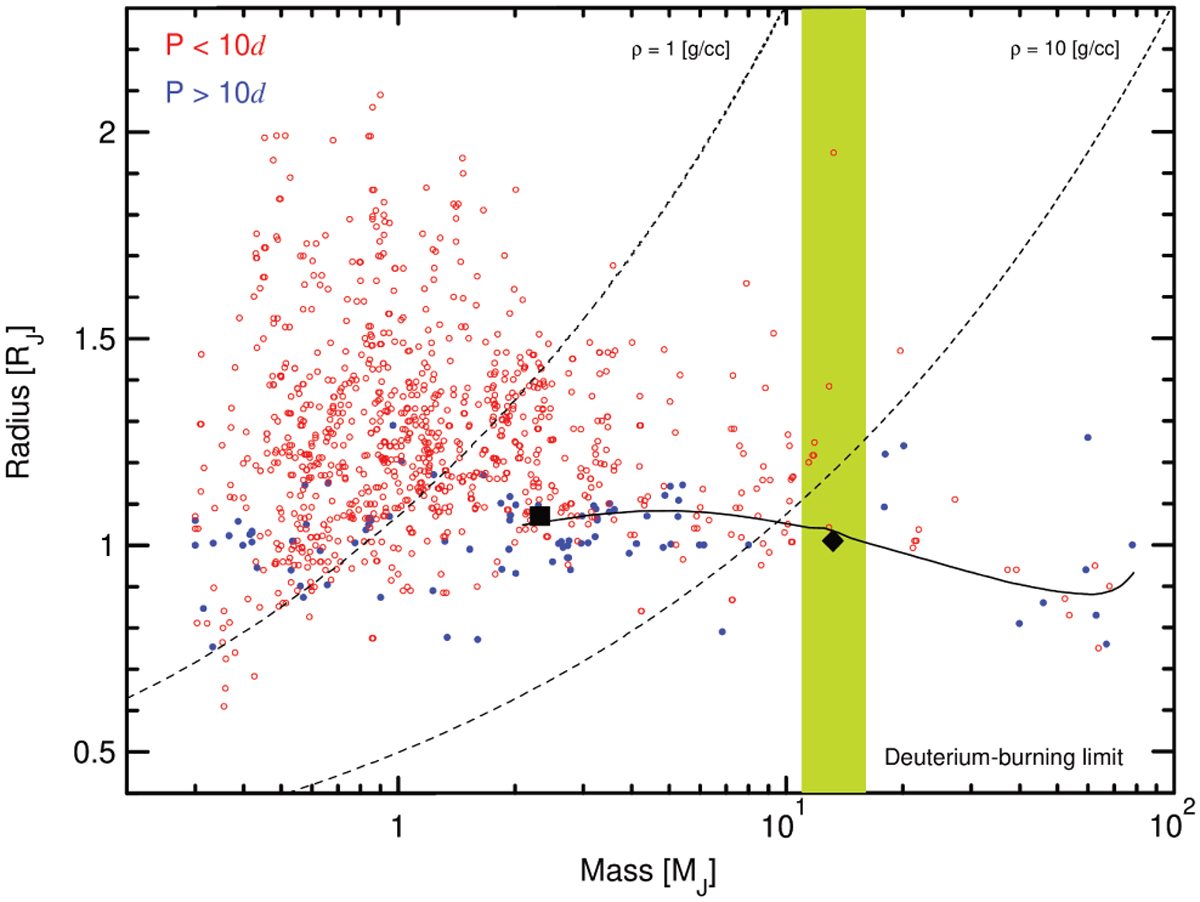
Mass-radius distribution of known transiting giant planets as of June 30, 2023. The open red circles and blue dots correspond to orbital periods shorter and longer than 10 days, respectively. The positions of TIC 4672985 b (black diamond) and TOI-2529 b (black square) are also shown. The shaded area represents the theoretical deuterium-burning limit. The solid line corresponds to a 1 Gyr old and solar metallicity ATMO2020 isochrone. Two isodensity curves for 1 and 10 [gr cm−3] are also plotted (dashed left and right lines, respectively).
Current usage metrics show cumulative count of Article Views (full-text article views including HTML views, PDF and ePub downloads, according to the available data) and Abstracts Views on Vision4Press platform.
Data correspond to usage on the plateform after 2015. The current usage metrics is available 48-96 hours after online publication and is updated daily on week days.
Initial download of the metrics may take a while.