Open Access
Fig. 11
Download original image
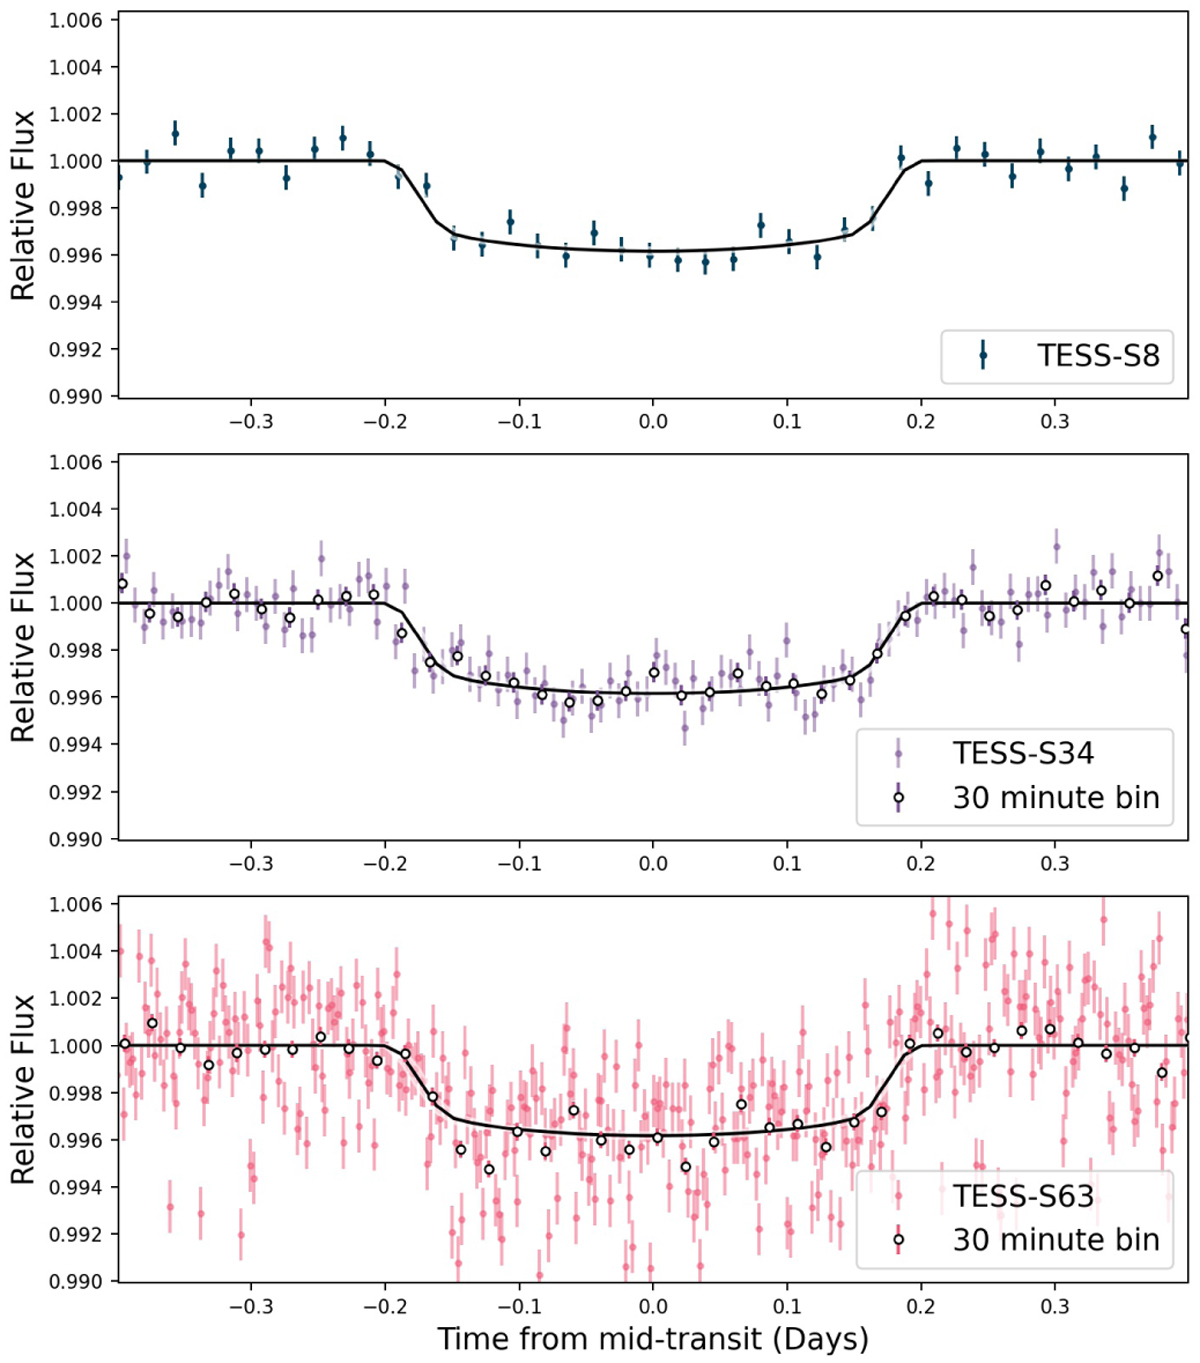
Normalized TESS photometry of TOI-2529 around the transit in sectors 8, 34, and 63 (upper, middle, and lower panels, respectively). The 30-min binned data and the best-fit transit model are overplotted.
Current usage metrics show cumulative count of Article Views (full-text article views including HTML views, PDF and ePub downloads, according to the available data) and Abstracts Views on Vision4Press platform.
Data correspond to usage on the plateform after 2015. The current usage metrics is available 48-96 hours after online publication and is updated daily on week days.
Initial download of the metrics may take a while.