Fig. 9.
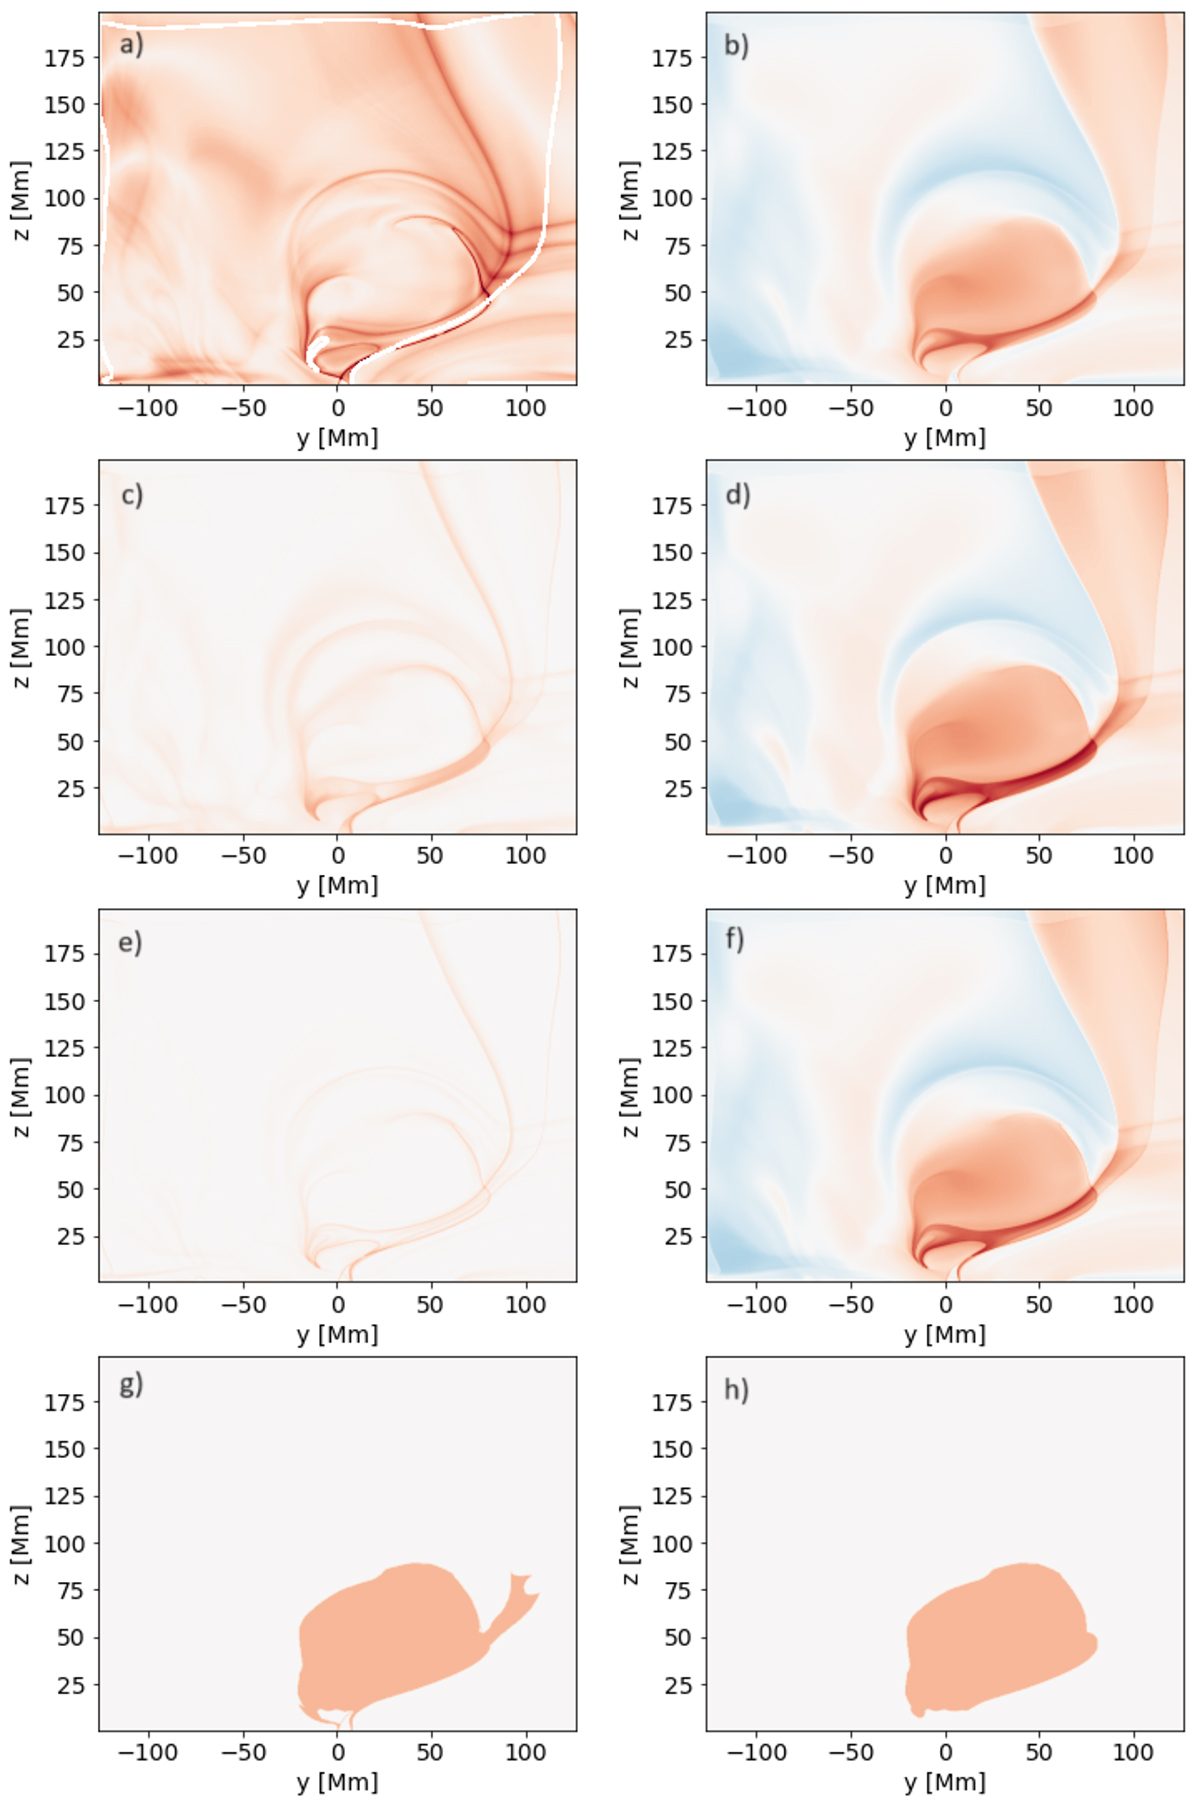
Download original image
Comparison of different parameters and processing for frame 16 of the AR12473 TMFM simulation in the plane of x ≈ 0.7 Mm: Panel a shows the log(Q) map, and panel b the twist map. The morphological gradient using big structuring elements is shown in panel c, and its combination with the twist map from (b) is shown in panel d. Panel e is the same as panel c, but with smaller structuring elements, and panel f is the combination of Tw from panel b with the morphological gradient in panel e. Finally, panel g shows the mask of high-twist areas as extracted from the twist+gradient map in panel d (using a threshold of 0.8); panel h shows the same mask, but after post-processing, mostly removing the twisted channel that connects to the main structure at about y = 75 Mm.
Current usage metrics show cumulative count of Article Views (full-text article views including HTML views, PDF and ePub downloads, according to the available data) and Abstracts Views on Vision4Press platform.
Data correspond to usage on the plateform after 2015. The current usage metrics is available 48-96 hours after online publication and is updated daily on week days.
Initial download of the metrics may take a while.