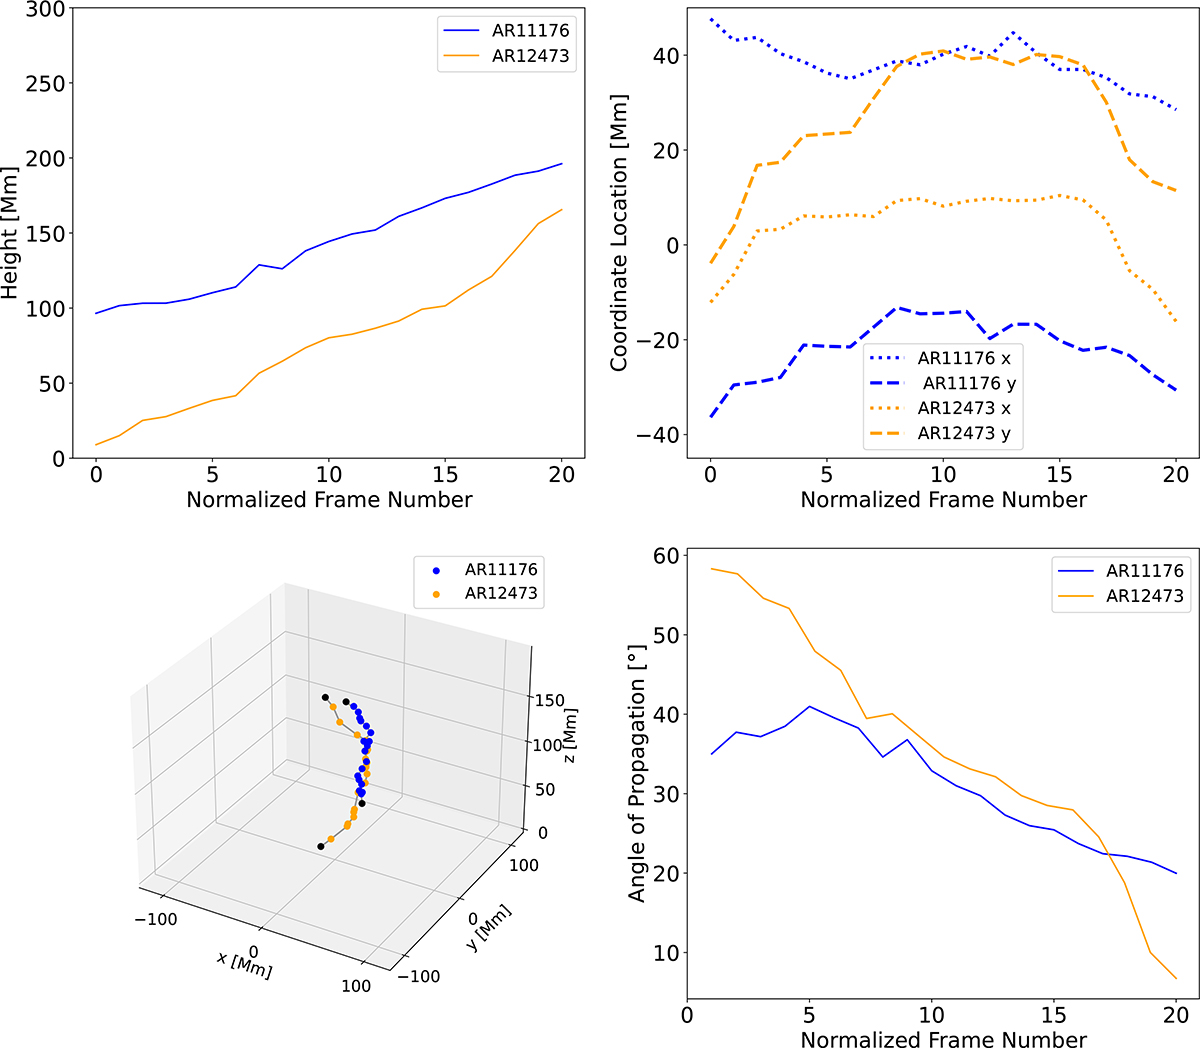
Fig. 8.
Download original image
Trajectory of the AR12473 (orange) and AR11176 (blue) TMFM FRs. The top left panel shows the height evolution, while the top right panel shows the evolution of the horizontal components during the ascend of the FRs. The bottom left panel shows the 3D trajectory in grey, with each computed apex point marked as an orange or blue dot; the start and end points are in black for better visibility. The bottom right panel depicts the angle of propagation for each time step. The frame numbers are normalised to start from 0 once the FR has formed.
Current usage metrics show cumulative count of Article Views (full-text article views including HTML views, PDF and ePub downloads, according to the available data) and Abstracts Views on Vision4Press platform.
Data correspond to usage on the plateform after 2015. The current usage metrics is available 48-96 hours after online publication and is updated daily on week days.
Initial download of the metrics may take a while.