Open Access
Fig. 9
Download original image
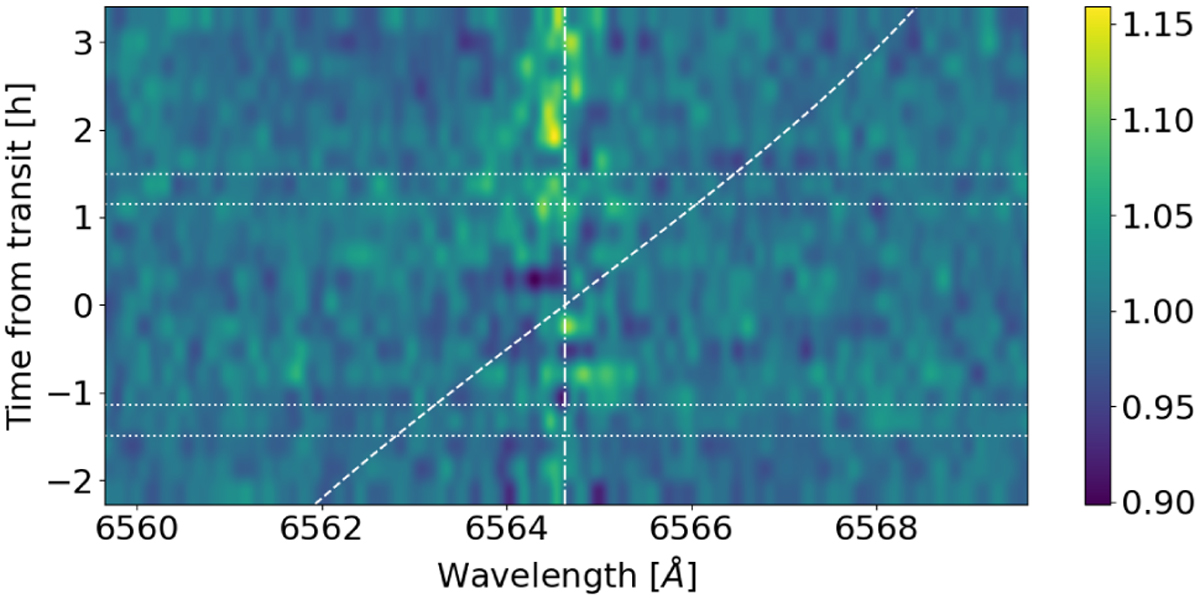
Ratio of night 2 and 1 spectra in the SF as a function of time from transit center. Horizontal dotted lines indicate the first to fourth contact, the dash-dotted vertical line denotes the nominal position of the Hα line, and the dashed diagonal line shows the orbital velocity track of the planet.
Current usage metrics show cumulative count of Article Views (full-text article views including HTML views, PDF and ePub downloads, according to the available data) and Abstracts Views on Vision4Press platform.
Data correspond to usage on the plateform after 2015. The current usage metrics is available 48-96 hours after online publication and is updated daily on week days.
Initial download of the metrics may take a while.