Open Access
Fig. 8
Download original image
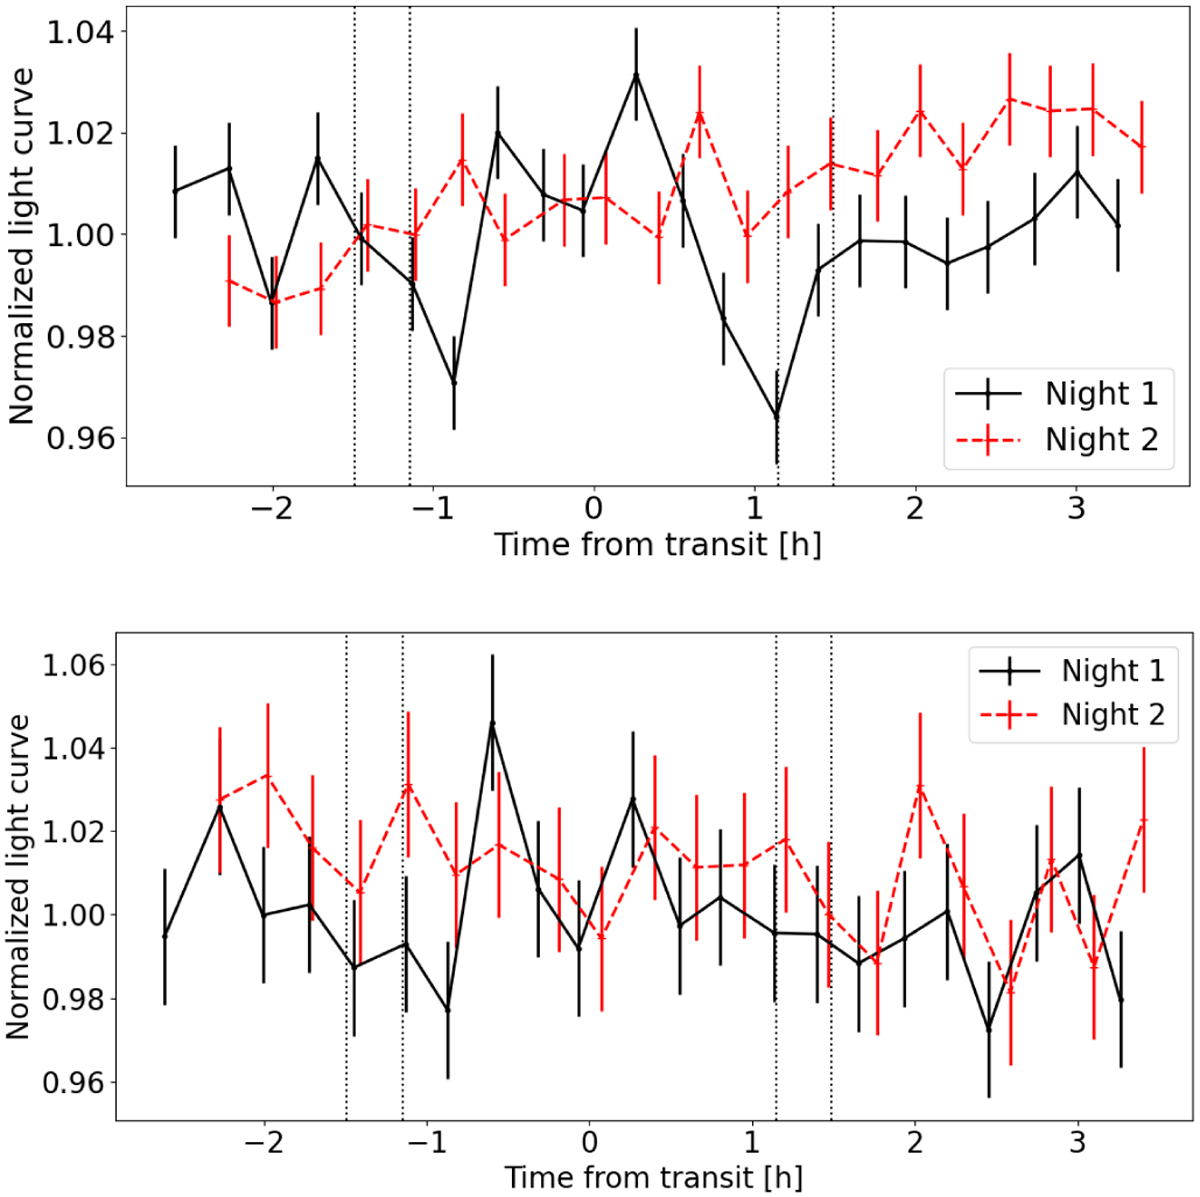
Light curves of the Hα and Ca IIIRT lines in the stellar frame. Top: Hα light curves (1.5 Å passband) normalized by the mean of the night 1 light curve. Bottom: as top but for 0.5 Å passband centered on bluest component of the Ca II IRT.
Current usage metrics show cumulative count of Article Views (full-text article views including HTML views, PDF and ePub downloads, according to the available data) and Abstracts Views on Vision4Press platform.
Data correspond to usage on the plateform after 2015. The current usage metrics is available 48-96 hours after online publication and is updated daily on week days.
Initial download of the metrics may take a while.