Fig. 6
Download original image
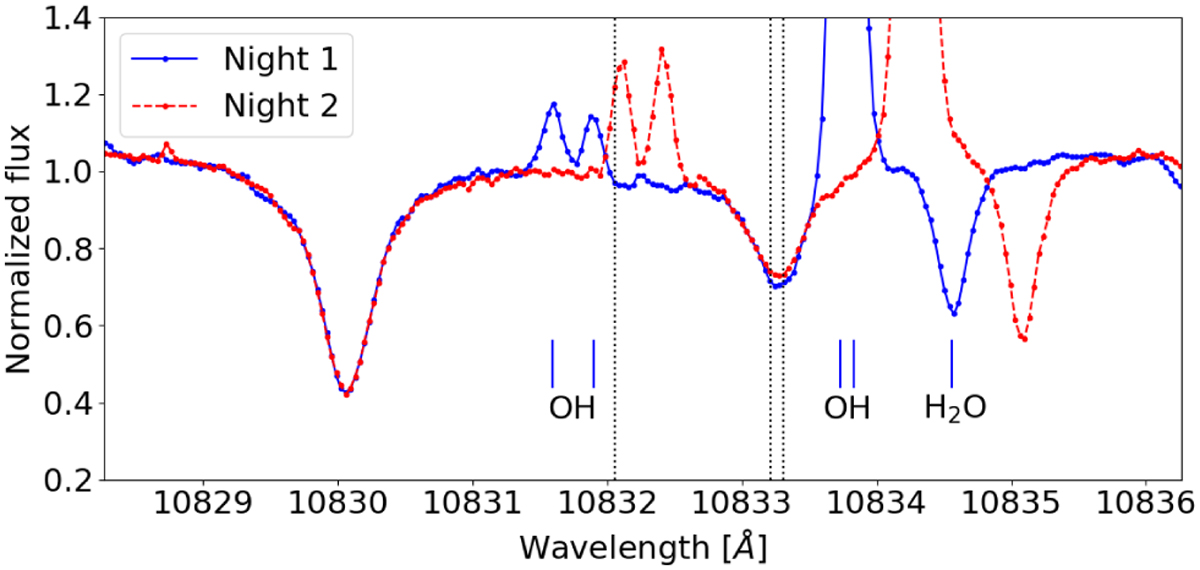
Average spectrum of WASP–12 during night 1 and 2 in the SF before correction for telluric absorption lines. Dotted vertical lines indicate the nominal wavelengths of the lines of the He I λ10833 Å triplet. Marks at the bottom indicate the nominal wavelengths of the four OH emission lines and the strongest water line during night 1.
Current usage metrics show cumulative count of Article Views (full-text article views including HTML views, PDF and ePub downloads, according to the available data) and Abstracts Views on Vision4Press platform.
Data correspond to usage on the plateform after 2015. The current usage metrics is available 48-96 hours after online publication and is updated daily on week days.
Initial download of the metrics may take a while.