Fig. 12
Download original image
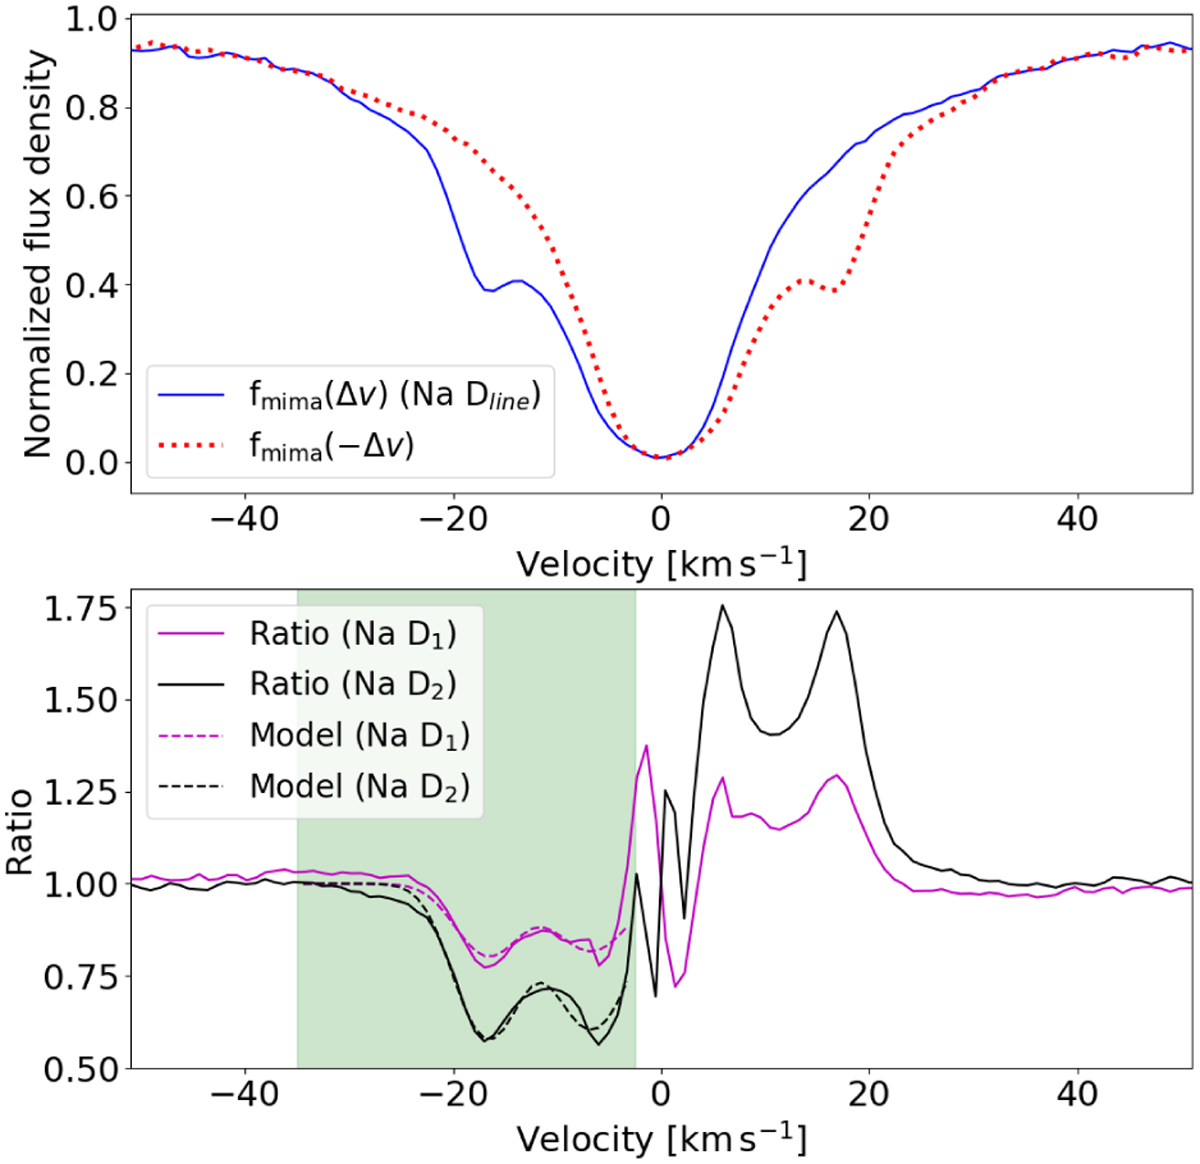
Properties of the Na I D lines of WASP–12. Top panel: Na I D2 line of WASP–12 (solid blue) along with spectrum reflected at nominal wavelength of the line (red dashed). Bottom panel: ratio between original and reflected spectrum for Na I D1 and Na I D2 lines (solid magenta and black) along with best-fit model (dashed magenta and black). The green shade indicates the considered fit range.
Current usage metrics show cumulative count of Article Views (full-text article views including HTML views, PDF and ePub downloads, according to the available data) and Abstracts Views on Vision4Press platform.
Data correspond to usage on the plateform after 2015. The current usage metrics is available 48-96 hours after online publication and is updated daily on week days.
Initial download of the metrics may take a while.