Open Access
Fig. 7.
Download original image
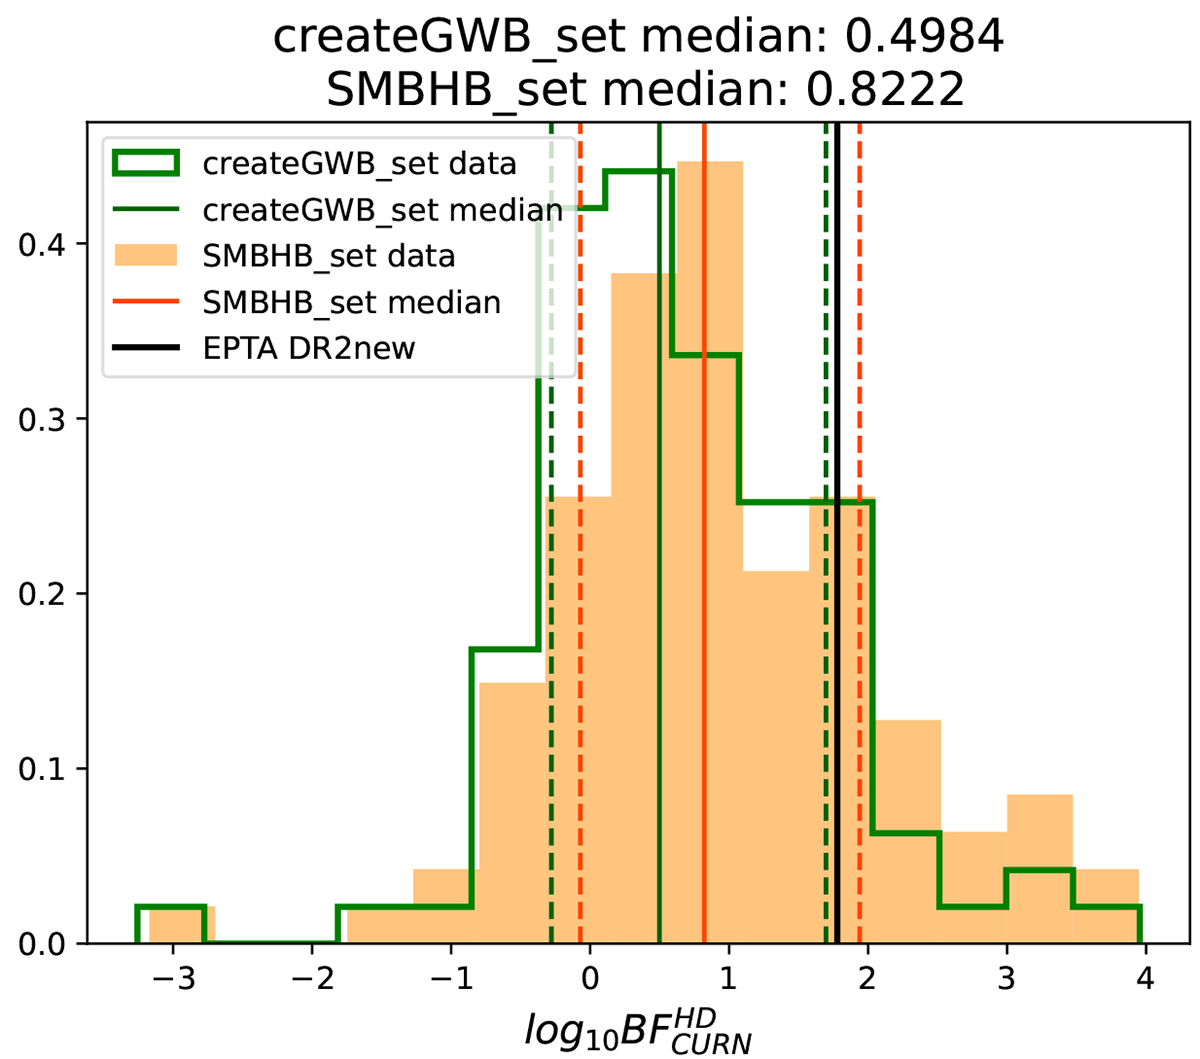
Histograms of the ![]() obtained from the reweighting analysis on the createGWB (green) and SMBHB_set (orange). The solid vertical lines show the medians of the distributions, while the dashed ones refer to the 16th and 84th percentiles. The black vertical line corresponds to the latest EPTA estimate for DR2new:
obtained from the reweighting analysis on the createGWB (green) and SMBHB_set (orange). The solid vertical lines show the medians of the distributions, while the dashed ones refer to the 16th and 84th percentiles. The black vertical line corresponds to the latest EPTA estimate for DR2new: ![]() .
.
Current usage metrics show cumulative count of Article Views (full-text article views including HTML views, PDF and ePub downloads, according to the available data) and Abstracts Views on Vision4Press platform.
Data correspond to usage on the plateform after 2015. The current usage metrics is available 48-96 hours after online publication and is updated daily on week days.
Initial download of the metrics may take a while.