Fig. 5.
Download original image
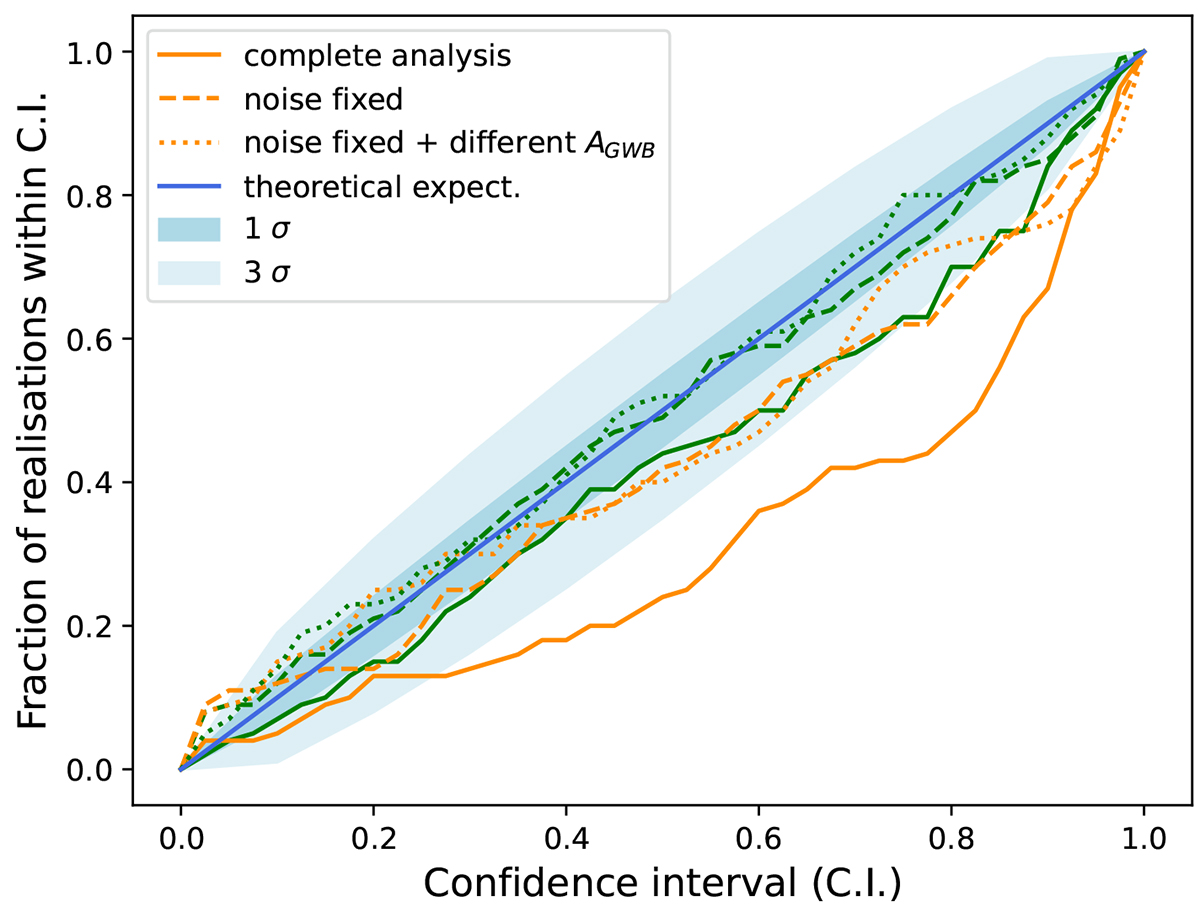
P–P plot for the recovery of AGWB from the SMHBH_set (orange) and createGWB_set (green). The solid lines are obtained from the log10AGWB posteriors of the MCMC runs over all 62 noise parameters of the pulsars array. The dashed lines are obtained by fixing all noise parameters in the recovery model; thus, AGWB is the only free parameter. The dotted lines are also from posteriors obtained sampling only over AGWB, but in a dataset where the realisations do not all have the same spectral amplitude. Here, the injected background has an amplitude value extracted from the prior distribution used in the recovery.
Current usage metrics show cumulative count of Article Views (full-text article views including HTML views, PDF and ePub downloads, according to the available data) and Abstracts Views on Vision4Press platform.
Data correspond to usage on the plateform after 2015. The current usage metrics is available 48-96 hours after online publication and is updated daily on week days.
Initial download of the metrics may take a while.