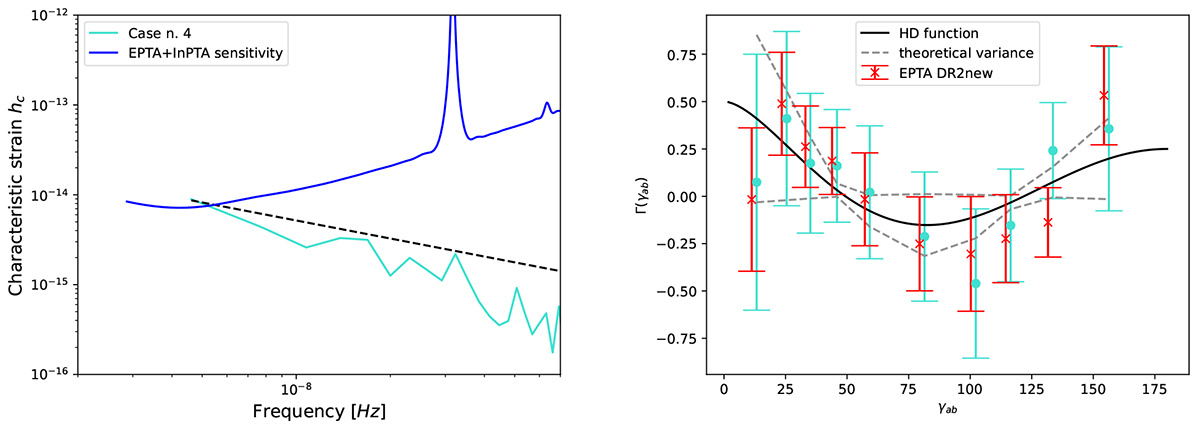
Fig. 11.
Download original image
Case4 analysis. The left panel shows the characteristic strain spectrum compared to the f−2/3 trend (dashed black line). The sensitivity curve is the one presented in The International Pulsar Timing Array Collaboration et al. (2023). Right panel: comparison between the recovered angular correlation in the residuals for this specific realisation (light blue points) and the results for the EPTA DR2new dataset (red). The expected variance of the optimal correlation estimator, for the EPTA 25 best pulsars array, is derived from prescriptions in Allen & Romano (2023).
Current usage metrics show cumulative count of Article Views (full-text article views including HTML views, PDF and ePub downloads, according to the available data) and Abstracts Views on Vision4Press platform.
Data correspond to usage on the plateform after 2015. The current usage metrics is available 48-96 hours after online publication and is updated daily on week days.
Initial download of the metrics may take a while.