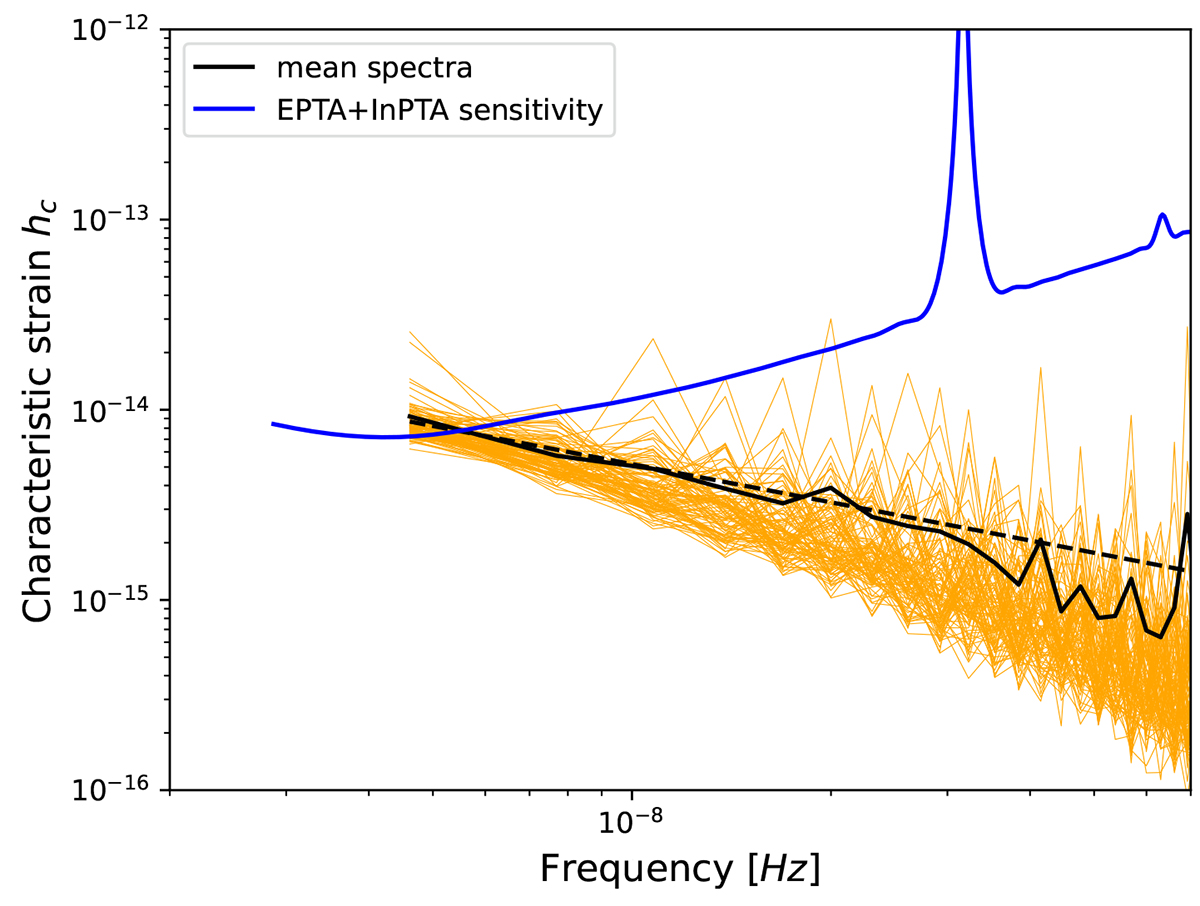
Fig. 1.
Download original image
Characteristic strain as a function of frequency for 100 different realisations of a GWB with nominal amplitude 2.4 × 10⁻¹⁵. Each orange line corresponds to a different realisation (SMBHB population). The solid black line is the mean of those realisations, while the dashed black line highlights the nominal f−2/3 spectrum. The sensitivity curve is derived in The International Pulsar Timing Array Collaboration et al. (2023).
Current usage metrics show cumulative count of Article Views (full-text article views including HTML views, PDF and ePub downloads, according to the available data) and Abstracts Views on Vision4Press platform.
Data correspond to usage on the plateform after 2015. The current usage metrics is available 48-96 hours after online publication and is updated daily on week days.
Initial download of the metrics may take a while.