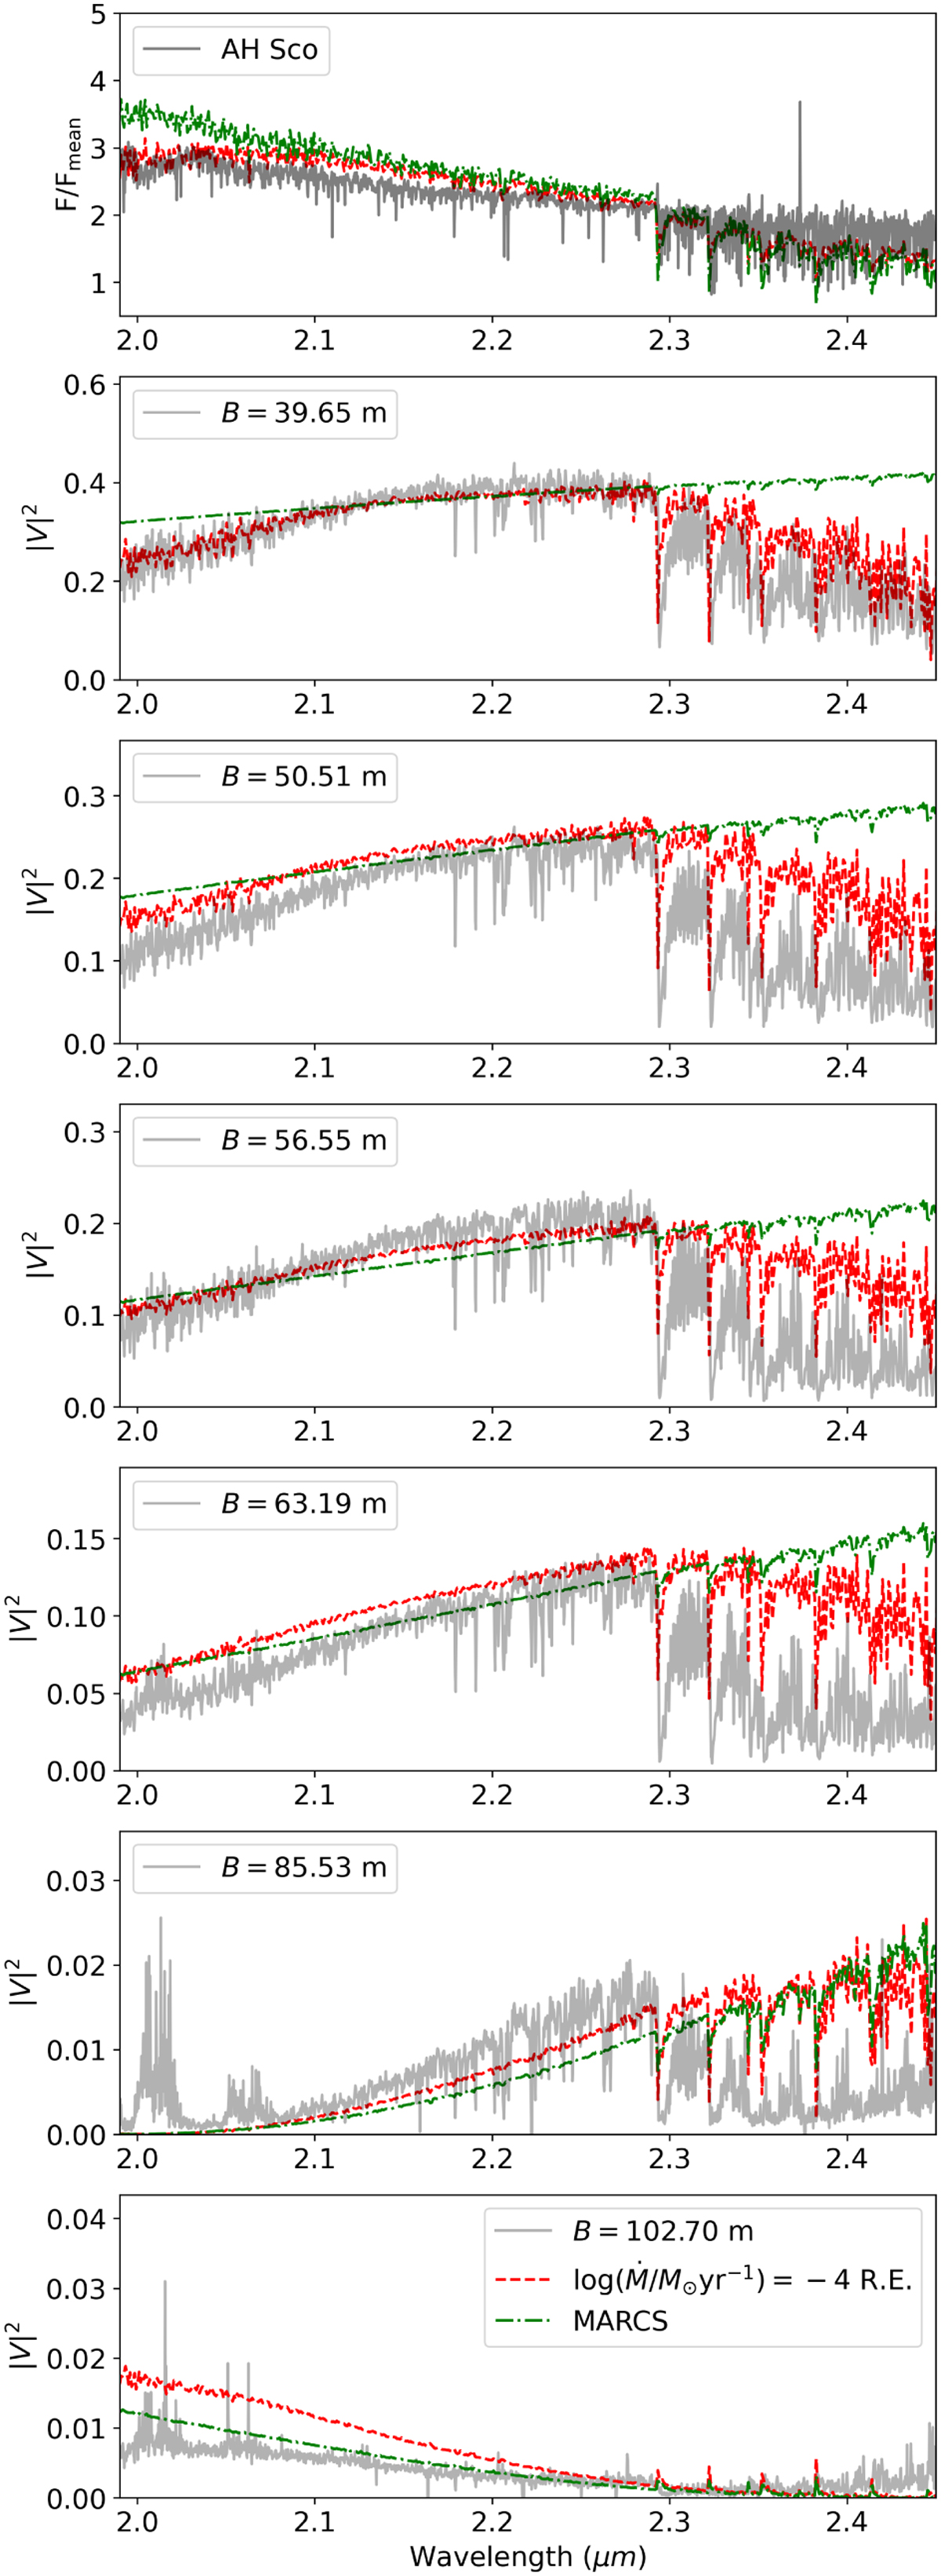
Fig. 2
Download original image
GRAVITY data, best-fit model, and pure MARCS model fit for AH Sco. Upper panel: normalised flux for the RSG AH Sco (grey), as observed with VLTI/GRAVITY for the K band. Our best-fit model is shown in red for RE, while the pure MARCS model fit is shown in green. Lower panels: same as the upper panel but for the |V|2 with different baselines. Both flux and |V|2 are better represented by our fit.
Current usage metrics show cumulative count of Article Views (full-text article views including HTML views, PDF and ePub downloads, according to the available data) and Abstracts Views on Vision4Press platform.
Data correspond to usage on the plateform after 2015. The current usage metrics is available 48-96 hours after online publication and is updated daily on week days.
Initial download of the metrics may take a while.