Fig. A.8
Download original image
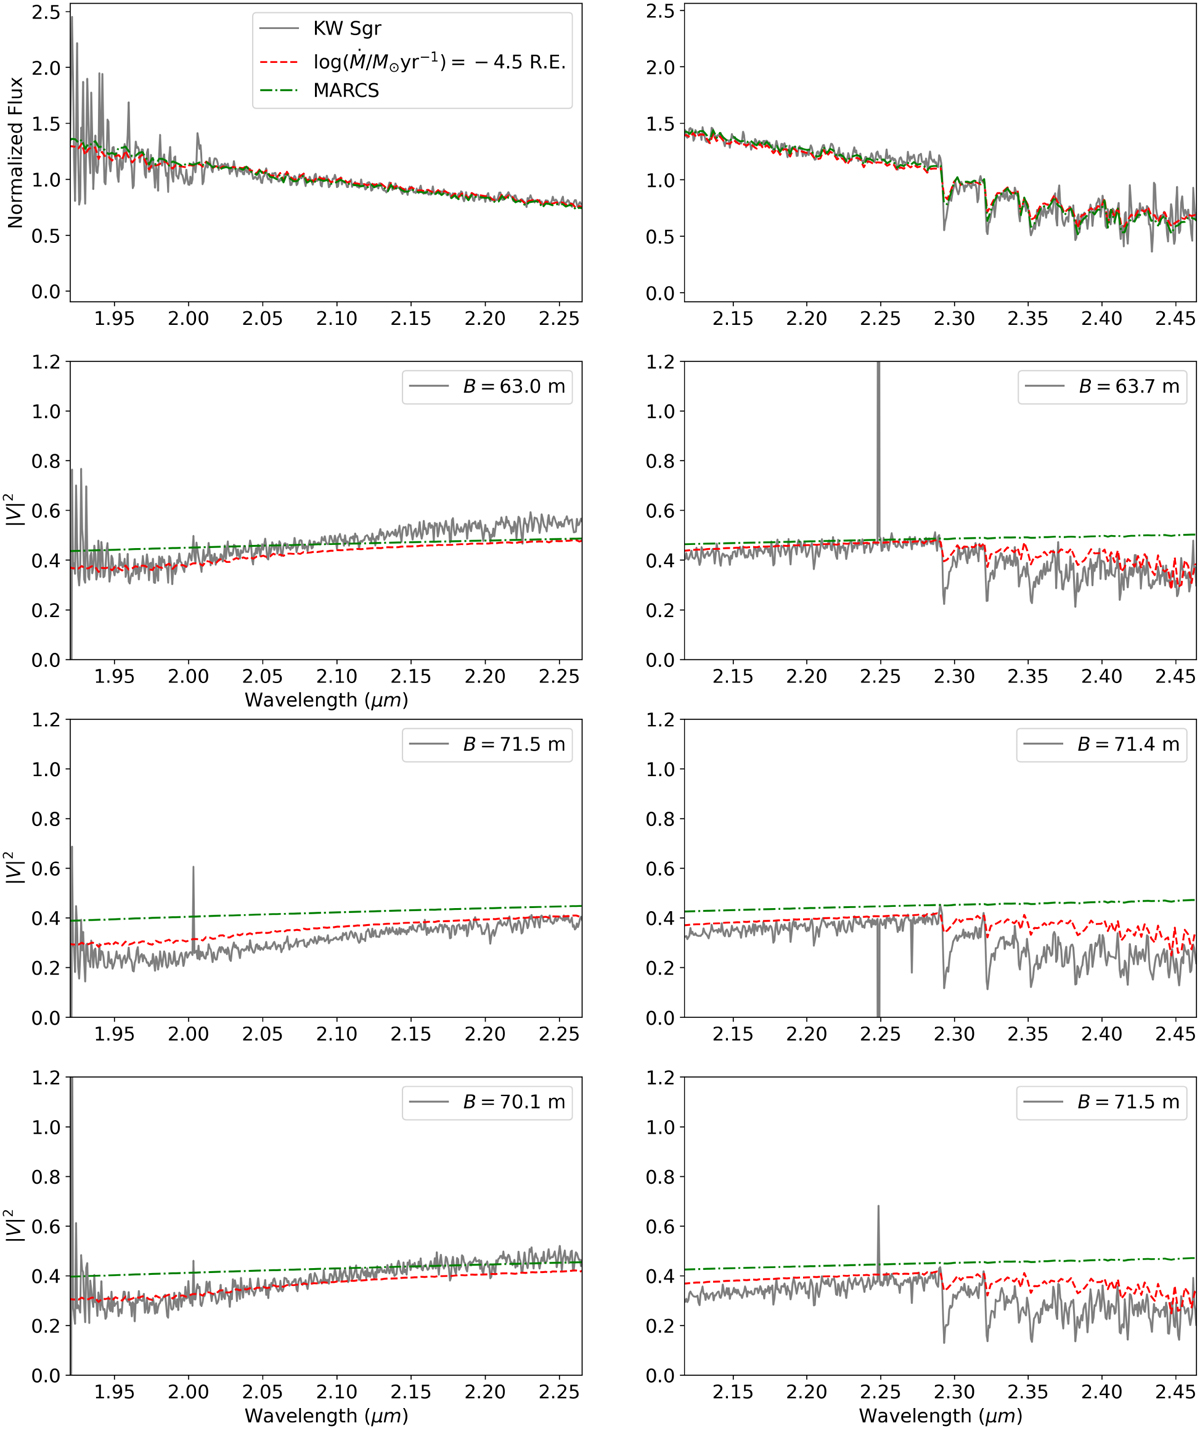
AMBER data, best-fit model, and pure MARCS model fit for KW Sgr. Upper left: Normalised flux for the RSG KW Sgr (grey), as observed with VLT/AMBER for the K − 2.1 μm bands. Our best-fit model is shown in red, and the pure MARCS model fit is shown in green. As expected, the fluxes are well represented by both our fit and MARCS. Upper right: Same as the upper-left panel, but for the K − 2.3 μm band. Lower left: Same as the upper-left panel, but for the |V|2 with the different baselines. Lower right: Same as the lower-right panel, but for the K − 2.3 μm band and different baselines. Our model can represent the data better than a pure MARCS model.
Current usage metrics show cumulative count of Article Views (full-text article views including HTML views, PDF and ePub downloads, according to the available data) and Abstracts Views on Vision4Press platform.
Data correspond to usage on the plateform after 2015. The current usage metrics is available 48-96 hours after online publication and is updated daily on week days.
Initial download of the metrics may take a while.