Fig. 3.
Download original image
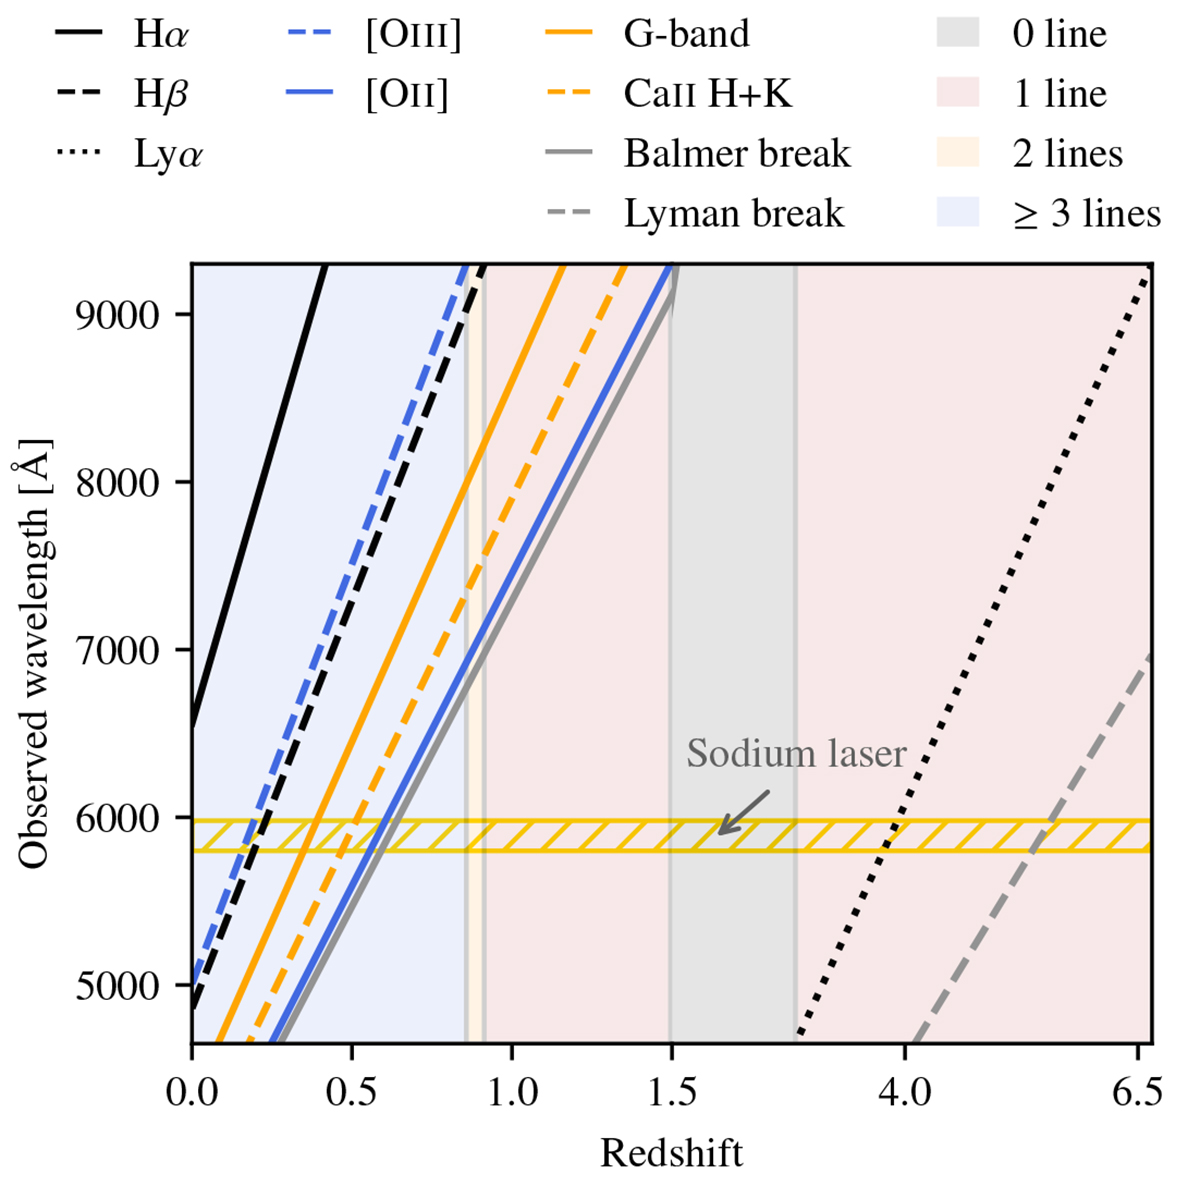
Main spectral features falling in the MUSE spectral range as a function of redshift. Hydrogen Balmer and Lyman lines are shown in black, oxygen lines in blue, absorption lines in orange, and continuum breaks in gray. The background colors indicate the number of bright emission lines simultaneously visible in the MUSE spectral range. As an indication, the spectral window unavailable in AO observations is shown as the horizontal hatched yellow region.
Current usage metrics show cumulative count of Article Views (full-text article views including HTML views, PDF and ePub downloads, according to the available data) and Abstracts Views on Vision4Press platform.
Data correspond to usage on the plateform after 2015. The current usage metrics is available 48-96 hours after online publication and is updated daily on week days.
Initial download of the metrics may take a while.