Fig. 22.
Download original image
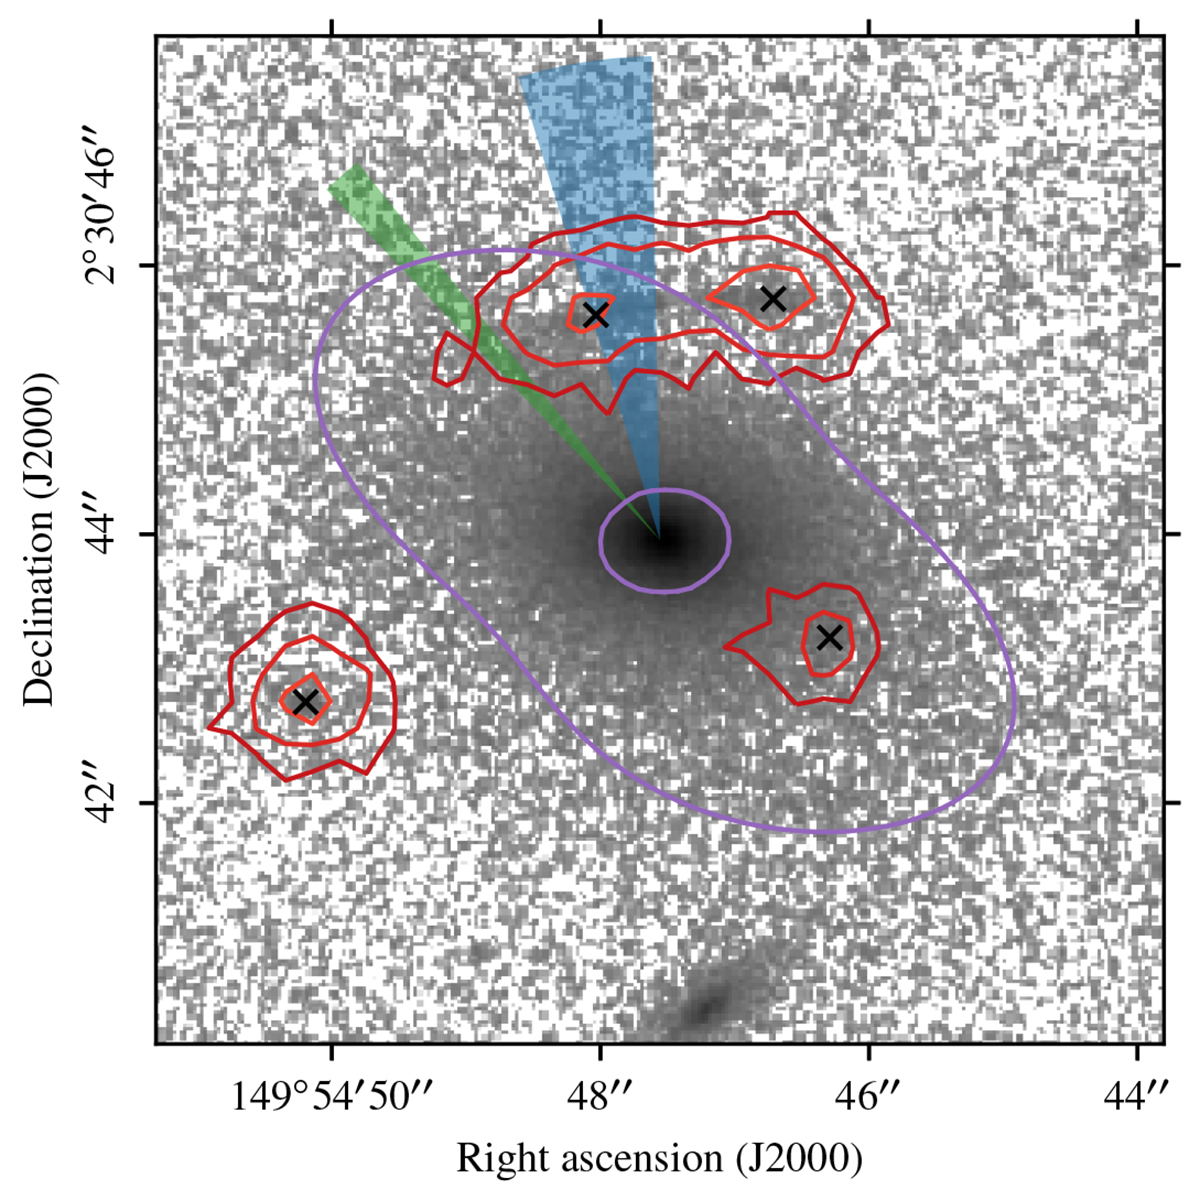
F814W HST-ACS image centered on the lensing source, 152_CGr32, at z = 0.72519 in logarithmic scale (arbitrary unit). The red contours represent the Lyα emission of the lensed source at z = 4.0973 at levels 1, 2, and 4 × 10⁻¹⁷ erg s−1 cm−2 arcsec−2. It is estimated by collapsing the MUSE cube over 20 Å at the observed wavelength of the Lyα line, and by subtracting the continuum using 50 Å wide adjacent wavelength ranges on both sides of the Lyα range. The four images are identified with black crosses, the lens model critical lines are displayed in purple, and the blue wedge indicates the range in the directions to the massive structure responsible for the shear in the lens model, at 1σ. The green wedge represents the center directions between the barycenter of CGr32 members inferred from MUSE data and the X-ray center.
Current usage metrics show cumulative count of Article Views (full-text article views including HTML views, PDF and ePub downloads, according to the available data) and Abstracts Views on Vision4Press platform.
Data correspond to usage on the plateform after 2015. The current usage metrics is available 48-96 hours after online publication and is updated daily on week days.
Initial download of the metrics may take a while.