Fig. 21.
Download original image
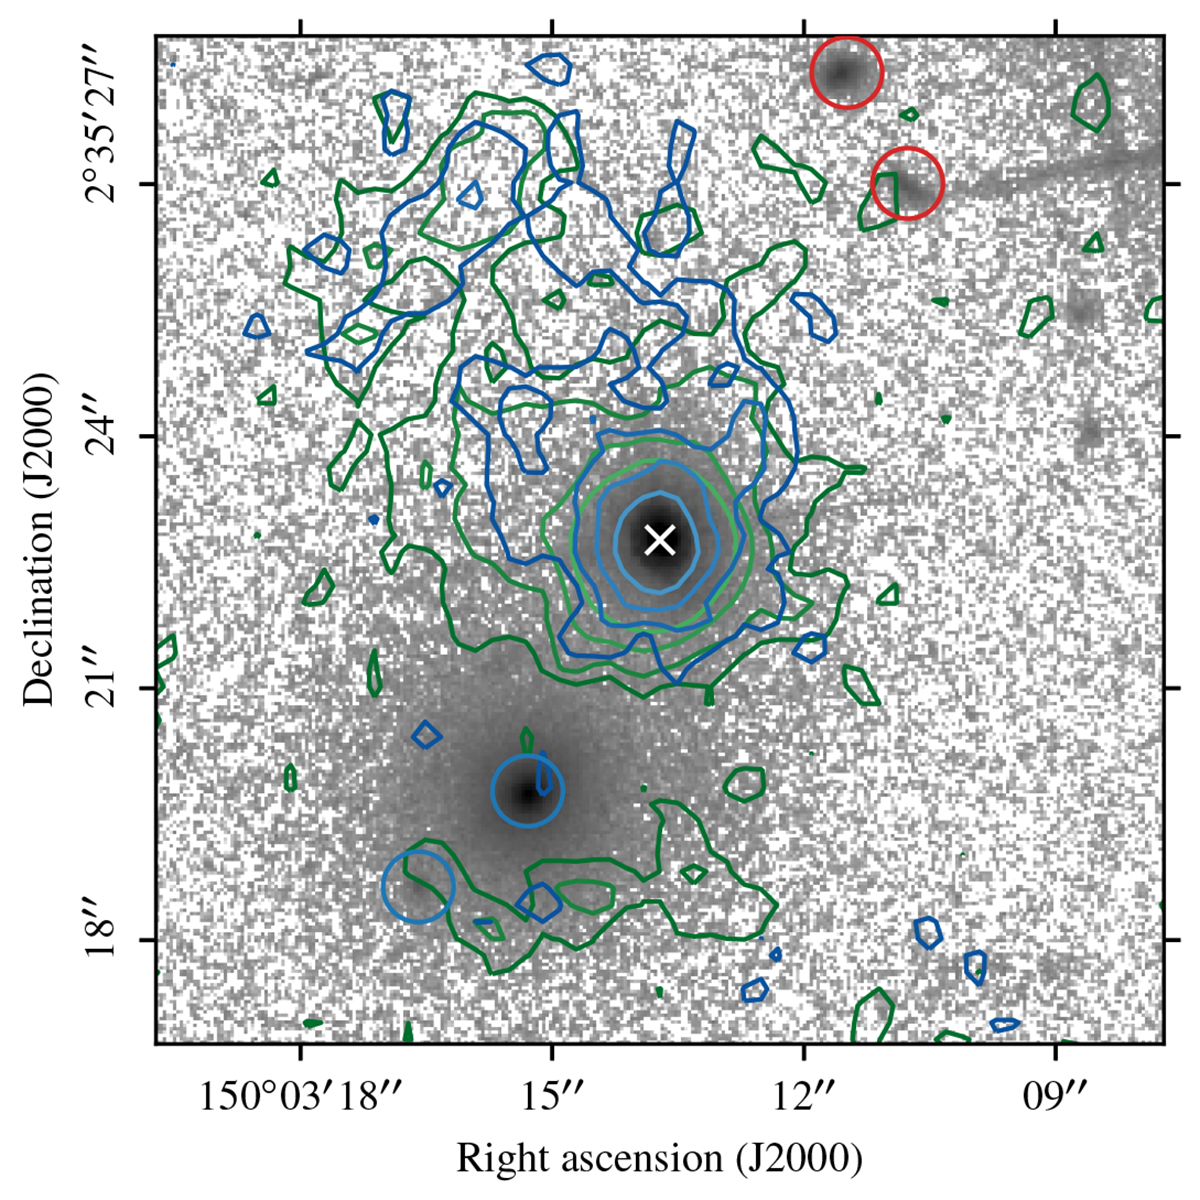
F814W HST-ACS image of the surroundings of the QSO 231_CGr84 at z = 0.7002, centered on the QSO (identified with a white cross), in logarithmic scale (arbitrary unit). The circles correspond to galaxies in the COSMOS2015 catalog within the field with secure redshifts, either in the foreground (blue) or in the background (red). The green and blue contours represent the O III]λ5007 and [O II] emission lines respectively, at levels 0.25, 0.5, 1, and 2 × 10⁻¹⁷ erg s−1 cm−2 arcsec−2 after a Gaussian spatial smoothing of two pixels FWHM. Contours are estimated by collapsing the MUSE cube over 20 Å at the observed wavelength of both lines, and by subtracting the continuum using 50 Å wide adjacent wavelength ranges on both sides of the lines.
Current usage metrics show cumulative count of Article Views (full-text article views including HTML views, PDF and ePub downloads, according to the available data) and Abstracts Views on Vision4Press platform.
Data correspond to usage on the plateform after 2015. The current usage metrics is available 48-96 hours after online publication and is updated daily on week days.
Initial download of the metrics may take a while.