Fig. 19.
Download original image
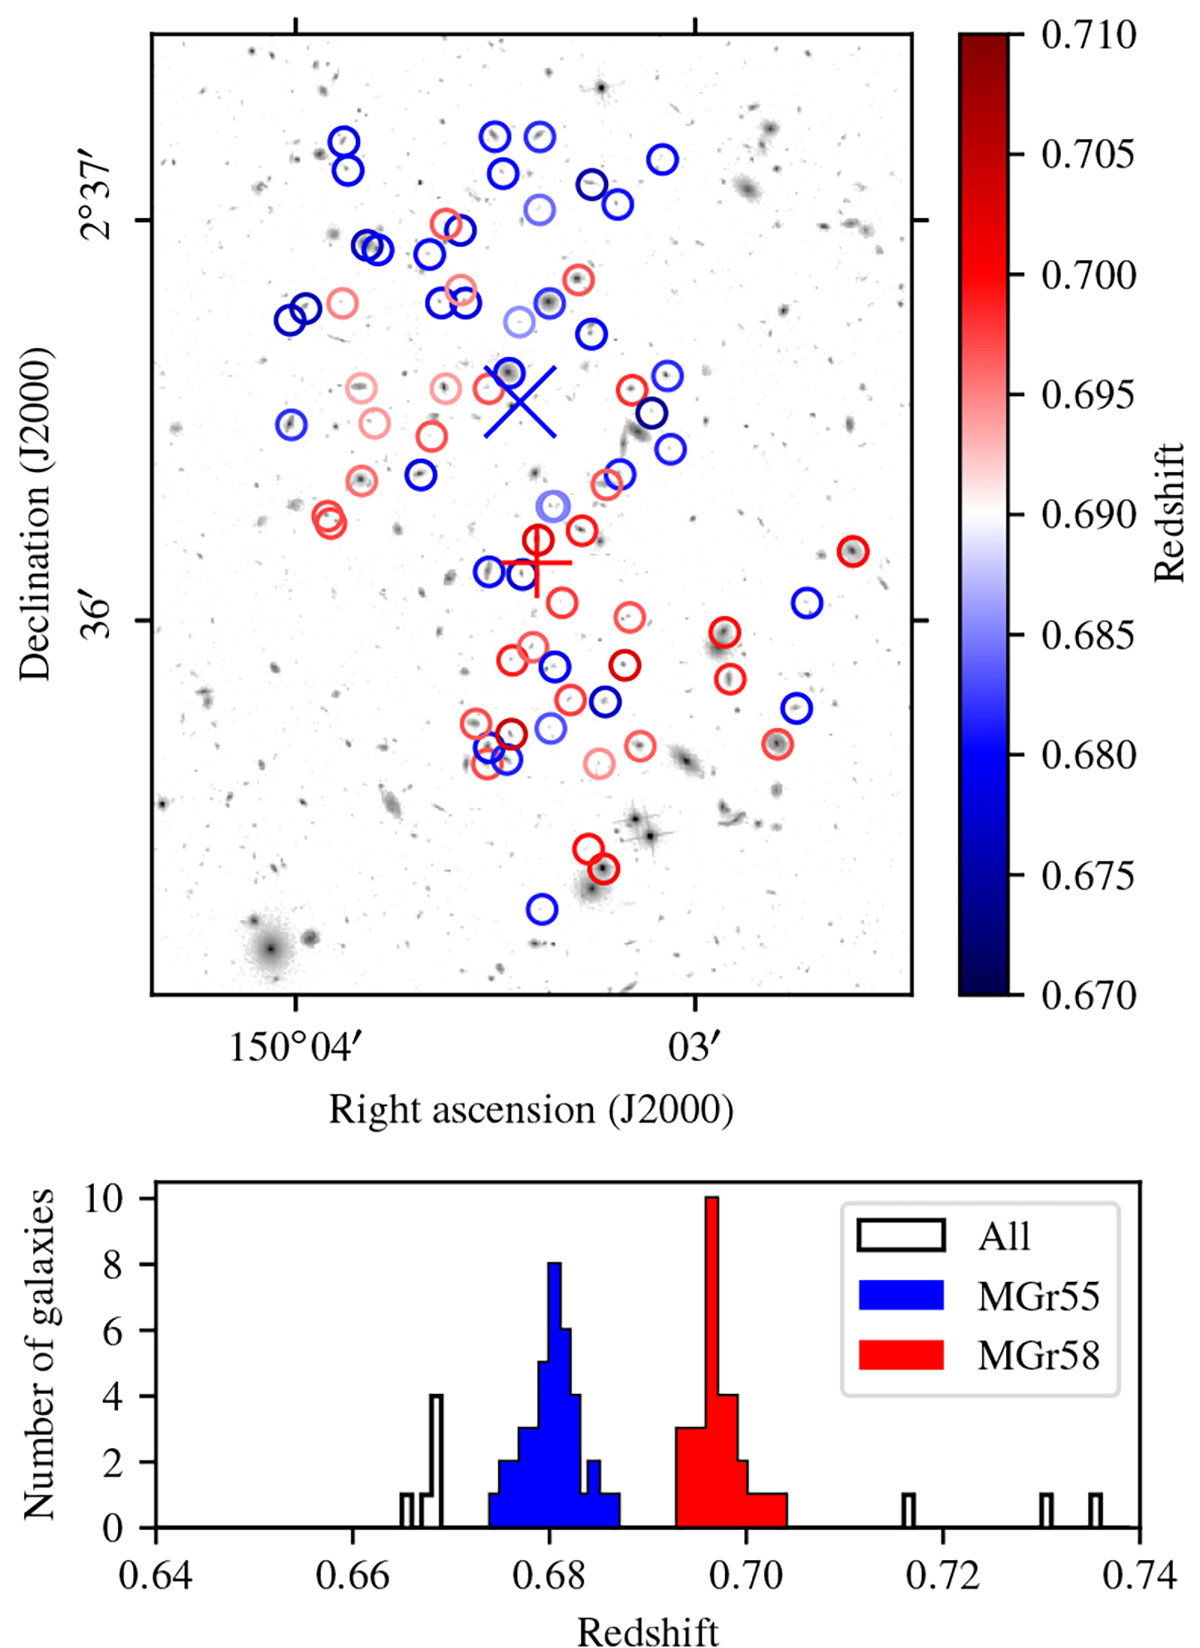
Two main groups in the CGr84 mosaic identified with the FoF algorithm. The top map shows the F814W HST-ACS image in logarithmic scale (arbitrary unit) covering the two MUSE fields over CGr84. Colored circle correspond to galaxies with MUSE secure spectroscopic redshifts (confidence ≥ 2) in the range of 0.67 < z < 0.71. The redshift distribution is shown on the bottom histograms. Two structures in blue (MGr55, 39 members) and red (MGr58 or CGr84, 33 members) are identified and clearly separated in redshift space, though they overlap in their spatial distribution. Their respective centers from MUSE data are displayed as blue and red crosses.
Current usage metrics show cumulative count of Article Views (full-text article views including HTML views, PDF and ePub downloads, according to the available data) and Abstracts Views on Vision4Press platform.
Data correspond to usage on the plateform after 2015. The current usage metrics is available 48-96 hours after online publication and is updated daily on week days.
Initial download of the metrics may take a while.