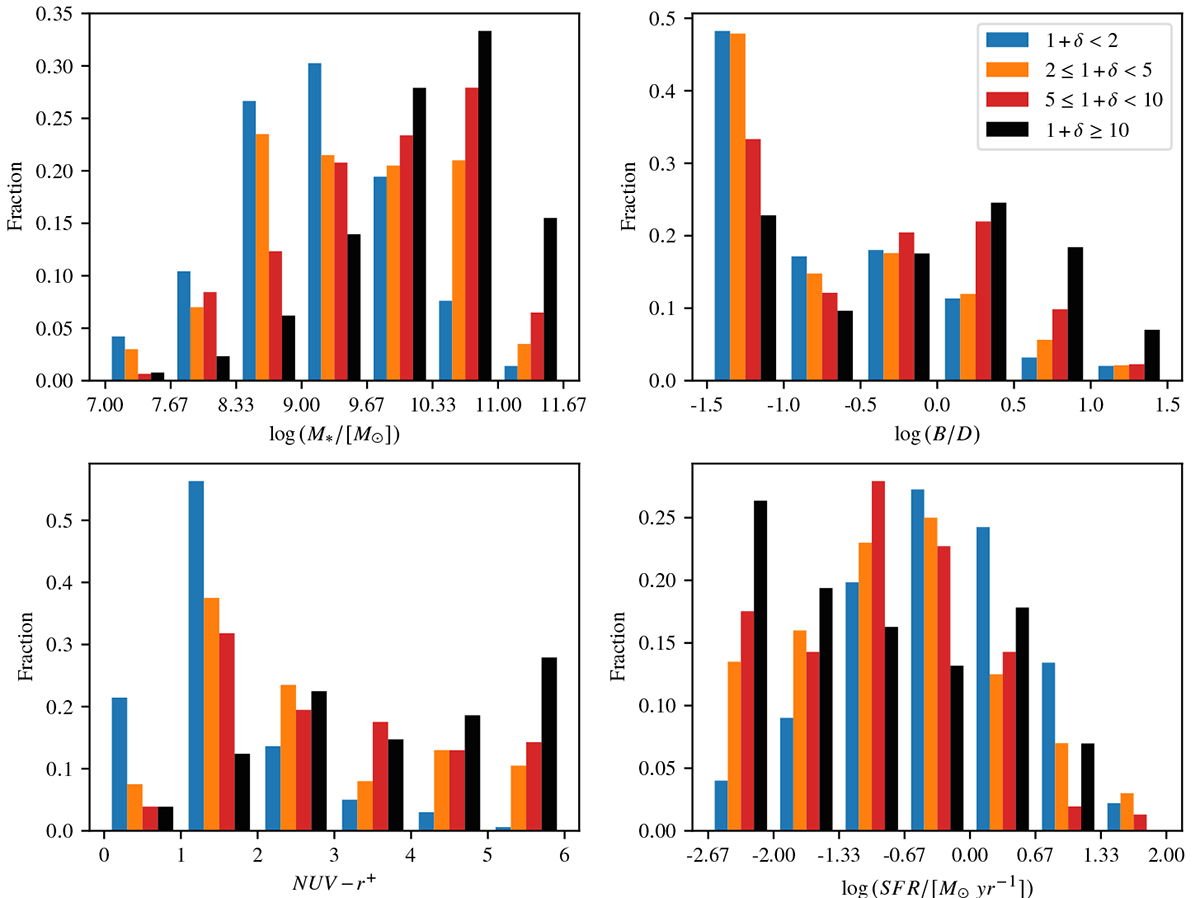
Fig. 17.
Download original image
Histograms of stellar mass (top left panel), bulge-to-disc ratio within the galaxy effective radius (top right panel), color (bottom left panel), and SFR (bottom right panel) using the four VMC overdensity classes (see Sect. 5.1 and Table 5). For each class in each histogram, the leftmost and rightmost bins contain all objects with values below and above the corresponding limits, respectively.
Current usage metrics show cumulative count of Article Views (full-text article views including HTML views, PDF and ePub downloads, according to the available data) and Abstracts Views on Vision4Press platform.
Data correspond to usage on the plateform after 2015. The current usage metrics is available 48-96 hours after online publication and is updated daily on week days.
Initial download of the metrics may take a while.